Western Union 2013 Annual Report Download - page 117
Download and view the complete annual report
Please find page 117 of the 2013 Western Union annual report below. You can navigate through the pages in the report by either clicking on the pages listed below, or by using the keyword search tool below to find specific information within the annual report.-
 1
1 -
2
-
3
-
4
-
5
-
6
-
7
-
8
-
9
-
10
-
11
-
12
-
13
-
14
-
15
-
16
-
17
-
18
-
19
-
20
-
21
-
22
-
23
-
24
-
25
-
26
-
27
-
28
-
29
-
30
-
31
-
32
-
33
-
34
-
35
-
36
-
37
-
38
-
39
-
40
-
41
-
42
-
43
-
44
-
45
-
46
-
47
-
48
-
49
-
50
-
51
-
52
-
53
-
54
-
55
-
56
-
57
-
58
-
59
-
60
-
61
-
62
-
63
-
64
-
65
-
66
-
67
-
68
-
69
-
70
-
71
-
72
-
73
-
74
-
75
-
76
-
77
-
78
-
79
-
80
-
81
-
82
-
83
-
84
-
85
-
86
-
87
-
88
-
89
-
90
-
91
-
92
-
93
-
94
-
95
-
96
-
97
-
98
-
99
-
100
-
101
-
102
-
103
-
104
-
105
-
106
-
 107
107 -
 108
108 -
 109
109 -
 110
110 -
 111
111 -
 112
112 -
 113
113 -
 114
114 -
 115
115 -
 116
116 -
 117
117 -
 118
118 -
 119
119 -
 120
120 -
 121
121 -
 122
122 -
 123
123 -
 124
124 -
 125
125 -
 126
126 -
 127
127 -
128
-
129
-
130
-
131
-
132
-
133
-
134
-
135
-
136
-
137
-
138
-
139
-
140
-
141
-
142
-
143
-
144
-
145
-
146
-
147
-
148
-
149
-
150
-
151
-
152
-
153
-
154
-
155
-
156
-
157
-
158
-
159
-
160
-
161
-
162
-
163
-
164
-
165
-
166
-
167
-
168
-
169
-
170
-
171
-
172
-
173
-
174
-
175
-
176
-
177
-
178
-
179
-
180
-
181
-
182
-
183
-
184
-
185
-
186
-
187
-
188
-
189
-
190
-
191
-
192
-
193
-
194
-
195
-
196
-
197
-
198
-
199
-
200
-
201
-
202
-
203
-
204
-
205
-
206
-
207
-
208
-
209
-
210
-
211
-
212
-
213
-
214
-
215
-
216
-
217
-
218
-
219
-
220
-
221
-
222
-
223
-
224
-
225
-
226
-
227
-
228
-
229
-
230
-
231
-
232
-
233
-
234
-
235
-
236
-
237
-
238
-
239
-
240
-
241
-
242
-
243
-
244
-
245
-
246
-
247
-
248
-
249
-
250
-
251
-
252
-
253
-
254
-
255
-
256
-
257
-
258
-
259
-
260
-
261
-
262
-
263
-
264
-
265
-
266
-
267
-
268
-
269
-
270
-
271
-
272
-
273
-
274
 |
 |

2013 FORM 10-K
7
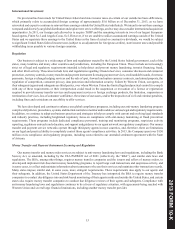
The table below presents the components of our consolidated revenue:
Year Ended December 31,
2013 2012 2011
Consumer-to-Consumer . . . . . . . . . . . . . . . . . . . . . . . . . . . . . . . . . . . . . . . . . . . . . . . . . . . . . . . . . . . 80% 81% 84%
Consumer-to-Business . . . . . . . . . . . . . . . . . . . . . . . . . . . . . . . . . . . . . . . . . . . . . . . . . . . . . . . . . . . . 11% 11% 11%
Business Solutions . . . . . . . . . . . . . . . . . . . . . . . . . . . . . . . . . . . . . . . . . . . . . . . . . . . . . . . . . . . . . . . 7% 6% 3%
Other . . . . . . . . . . . . . . . . . . . . . . . . . . . . . . . . . . . . . . . . . . . . . . . . . . . . . . . . . . . . . . . . . . . . . . . . . . 2% 2% 2%
100% 100% 100%
No individual country outside the United States accounted for more than approximately 6% of our consolidated revenue for
each of the years ended December 31, 2013, 2012 and 2011.
For additional details regarding our Consumer-to-Consumer, Consumer-to-Business and Business Solutions segments,
including financial information regarding our international and United States revenues and long-lived assets, see Part II, Item 7,
Management's Discussion and Analysis of Financial Condition and Results of Operations, and Part II, Item 8, Financial Statements
and Supplementary Data in this Annual Report on Form 10-K.
See Part I, Item 1A, Risk Factors, for a discussion of certain risks relating to our foreign operations.
Consumer-to-Consumer Segment
Individual money transfers from one consumer to another are the core of our business, representing 80% of our total
consolidated revenues for 2013. We view our money transfer service as one interconnected global network where a money transfer
can be sent from one location to another, around the world, including related transactions that can be initiated in certain countries
through websites and account based money transfers. The segment includes five geographic regions whose functions are limited
to generating, managing and maintaining agent relationships and localized marketing activities and also includes our online money
transfer service conducted through Western Union branded websites ("westernunion.com"). By means of common processes and
systems, these regions and westernunion.com create an interconnected network for consumer transactions, thereby constituting
one global Consumer-to-Consumer money transfer business and one operating segment.
Although most remittances are sent from one of our agent locations worldwide, in some countries we offer the ability to send
money over the Internet or phone using a credit or debit card, or through a withdrawal directly from a consumer's bank account.
All agent locations accept cash to initiate a transaction, and some also accept debit cards. We offer consumers several options to
receive a money transfer. While the vast majority of transfers are paid in cash at agent locations, in some places we offer payout
directly to the receiver's bank account, to a stored-value card, or through the issuance of a money order.
Operations
Our revenue in this segment is derived primarily from transaction fees charged to consumers to transfer money. In money
transfers involving different send and receive currencies, we also generate revenue based on the difference between the exchange
rate set by us to the consumer and the rate at which we or our agents are able to acquire the currency.