Western Union 2013 Annual Report Download - page 179
Download and view the complete annual report
Please find page 179 of the 2013 Western Union annual report below. You can navigate through the pages in the report by either clicking on the pages listed below, or by using the keyword search tool below to find specific information within the annual report.-
 1
1 -
2
-
3
-
4
-
5
-
6
-
7
-
8
-
9
-
10
-
11
-
12
-
13
-
14
-
15
-
16
-
17
-
18
-
19
-
20
-
21
-
22
-
23
-
24
-
25
-
26
-
27
-
28
-
29
-
30
-
31
-
32
-
33
-
34
-
35
-
36
-
37
-
38
-
39
-
40
-
41
-
42
-
43
-
44
-
45
-
46
-
47
-
48
-
49
-
50
-
51
-
52
-
53
-
54
-
55
-
56
-
57
-
58
-
59
-
60
-
61
-
62
-
63
-
64
-
65
-
66
-
67
-
68
-
69
-
70
-
71
-
72
-
73
-
74
-
75
-
76
-
77
-
78
-
79
-
80
-
81
-
82
-
83
-
84
-
85
-
86
-
87
-
88
-
89
-
90
-
91
-
92
-
93
-
94
-
95
-
96
-
97
-
98
-
99
-
100
-
101
-
102
-
103
-
104
-
105
-
106
-
107
-
108
-
109
-
110
-
111
-
112
-
113
-
114
-
115
-
116
-
117
-
118
-
119
-
120
-
121
-
122
-
123
-
124
-
125
-
126
-
127
-
128
-
129
-
130
-
131
-
132
-
133
-
134
-
135
-
136
-
137
-
138
-
139
-
140
-
141
-
142
-
143
-
144
-
145
-
146
-
147
-
148
-
149
-
150
-
151
-
152
-
153
-
154
-
155
-
156
-
157
-
158
-
159
-
160
-
161
-
162
-
163
-
164
-
165
-
166
-
167
-
168
-
 169
169 -
 170
170 -
 171
171 -
 172
172 -
 173
173 -
 174
174 -
 175
175 -
 176
176 -
 177
177 -
 178
178 -
 179
179 -
 180
180 -
 181
181 -
 182
182 -
 183
183 -
 184
184 -
 185
185 -
 186
186 -
 187
187 -
 188
188 -
 189
189 -
190
-
191
-
192
-
193
-
194
-
195
-
196
-
197
-
198
-
199
-
200
-
201
-
202
-
203
-
204
-
205
-
206
-
207
-
208
-
209
-
210
-
211
-
212
-
213
-
214
-
215
-
216
-
217
-
218
-
219
-
220
-
221
-
222
-
223
-
224
-
225
-
226
-
227
-
228
-
229
-
230
-
231
-
232
-
233
-
234
-
235
-
236
-
237
-
238
-
239
-
240
-
241
-
242
-
243
-
244
-
245
-
246
-
247
-
248
-
249
-
250
-
251
-
252
-
253
-
254
-
255
-
256
-
257
-
258
-
259
-
260
-
261
-
262
-
263
-
264
-
265
-
266
-
267
-
268
-
269
-
270
-
271
-
272
-
273
-
274
 |
 |

2013 FORM 10-K
69
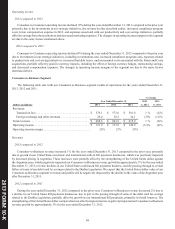
Operating income
2013 compared to 2012
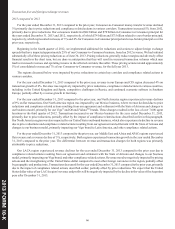
Operating income and operating margins decreased for the year ended December 31, 2013 compared to the prior year primarily
due to the items which impacted revenues described earlier. Operating income was also impacted by increased bank fees due to
our growing United States electronic business and higher information technology investments, partially offset by costs related to
the renegotiation of a sales and distribution agreement that occurred in the prior year.
2012 compared to 2011
During the year ended December 31, 2012, Consumer-to-Business operating income decreased compared to the prior year
primarily due to revenue declines in our United States cash-based bill payments business, the renegotiation of a sales and distribution
agreement, and expenses related to productivity and cost-savings initiatives, partially offset by a net decrease in debit card and
other bank fees due to the Durbin Legislation. The changes in operating income margins in the segment are due to the same factors
mentioned above.
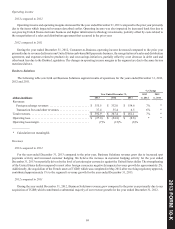
Business Solutions
The following table sets forth our Business Solutions segment results of operations for the years ended December 31, 2013,
2012 and 2011.
% Change
Year Ended December 31, 2013 2012
(dollars in millions) 2013 2012 2011 vs. 2012 vs. 2011
Revenues:
Foreign exchange revenues . . . . . . . . . . . . . . . . . . . . . . . . . . . $ 355.5 $ 332.0 $ 154.6 7% *
Transaction fees and other revenues. . . . . . . . . . . . . . . . . . . . . 37.4 35.4 6.5 6% *
Total revenues . . . . . . . . . . . . . . . . . . . . . . . . . . . . . . . . . . . . . . . . $ 392.9 $ 367.4 $ 161.1 7% *
Operating loss . . . . . . . . . . . . . . . . . . . . . . . . . . . . . . . . . . . . . . . . $ (27.0) $ (54.8) $ (9.6) * *
Operating loss margin . . . . . . . . . . . . . . . . . . . . . . . . . . . . . . . . . . (7)% (15)% (6)%
____________
* Calculation not meaningful.
Revenues
2013 compared to 2012
For the year ended December 31, 2013 compared to the prior year, Business Solutions revenue grew due to increased spot
payments activity and increased customer hedging. We believe the increase in customer hedging activity for the year ended
December 31, 2013 was partially driven by the level of certain major currencies against the United States dollar. The strengthening
of the United States dollar compared to most other foreign currencies negatively impacted revenue growth by approximately 2%.
Additionally, the acquisition of the French assets of TGBP, which was completed in May 2012 after receiving regulatory approval,
contributed approximately 1% to the segment's revenue growth for the year ended December 31, 2013.
2012 compared to 2011
During the year ended December 31, 2012, Business Solutions revenue grew compared to the prior year primarily due to our
acquisition of TGBP, which contributed a substantial majority of our revenue growth for the year ended December 31, 2012.