Western Union 2013 Annual Report Download - page 50
Download and view the complete annual report
Please find page 50 of the 2013 Western Union annual report below. You can navigate through the pages in the report by either clicking on the pages listed below, or by using the keyword search tool below to find specific information within the annual report.-
 1
1 -
2
-
3
-
4
-
5
-
6
-
7
-
8
-
9
-
10
-
11
-
12
-
13
-
14
-
15
-
16
-
17
-
18
-
19
-
20
-
21
-
22
-
23
-
24
-
25
-
26
-
27
-
28
-
29
-
30
-
31
-
32
-
33
-
34
-
35
-
36
-
37
-
38
-
39
-
 40
40 -
 41
41 -
 42
42 -
 43
43 -
 44
44 -
 45
45 -
 46
46 -
 47
47 -
 48
48 -
 49
49 -
 50
50 -
 51
51 -
 52
52 -
 53
53 -
 54
54 -
 55
55 -
 56
56 -
 57
57 -
 58
58 -
 59
59 -
 60
60 -
61
-
62
-
63
-
64
-
65
-
66
-
67
-
68
-
69
-
70
-
71
-
72
-
73
-
74
-
75
-
76
-
77
-
78
-
79
-
80
-
81
-
82
-
83
-
84
-
85
-
86
-
87
-
88
-
89
-
90
-
91
-
92
-
93
-
94
-
95
-
96
-
97
-
98
-
99
-
100
-
101
-
102
-
103
-
104
-
105
-
106
-
107
-
108
-
109
-
110
-
111
-
112
-
113
-
114
-
115
-
116
-
117
-
118
-
119
-
120
-
121
-
122
-
123
-
124
-
125
-
126
-
127
-
128
-
129
-
130
-
131
-
132
-
133
-
134
-
135
-
136
-
137
-
138
-
139
-
140
-
141
-
142
-
143
-
144
-
145
-
146
-
147
-
148
-
149
-
150
-
151
-
152
-
153
-
154
-
155
-
156
-
157
-
158
-
159
-
160
-
161
-
162
-
163
-
164
-
165
-
166
-
167
-
168
-
169
-
170
-
171
-
172
-
173
-
174
-
175
-
176
-
177
-
178
-
179
-
180
-
181
-
182
-
183
-
184
-
185
-
186
-
187
-
188
-
189
-
190
-
191
-
192
-
193
-
194
-
195
-
196
-
197
-
198
-
199
-
200
-
201
-
202
-
203
-
204
-
205
-
206
-
207
-
208
-
209
-
210
-
211
-
212
-
213
-
214
-
215
-
216
-
217
-
218
-
219
-
220
-
221
-
222
-
223
-
224
-
225
-
226
-
227
-
228
-
229
-
230
-
231
-
232
-
233
-
234
-
235
-
236
-
237
-
238
-
239
-
240
-
241
-
242
-
243
-
244
-
245
-
246
-
247
-
248
-
249
-
250
-
251
-
252
-
253
-
254
-
255
-
256
-
257
-
258
-
259
-
260
-
261
-
262
-
263
-
264
-
265
-
266
-
267
-
268
-
269
-
270
-
271
-
272
-
273
-
274
 |
 |

Compensation Discussion and Analysis PROXY STATEMENT
The Western Union Company – Proxy Statement | 32
NOTICE OF 2014 ANNUAL MEETING OF STOCKHOLDERS AND PROXY STATEMENT
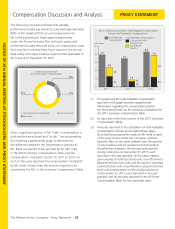
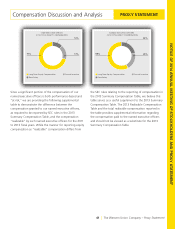
The following chart demonstrates that variable,
performance-based pay elements comprised approximately
88% of the targeted 2013 annual compensation for
Mr. Ersek (consisting of target payout opportunity
under the Annual Incentive Plan and stock option and
performance-based restricted stock unit components under
the Long-Term Incentive Plan). Pay is based on the annual
base salary and target incentive opportunities applicable to
Mr. Ersek as of December 31, 2013.
17%
12%
71%
Annual Incentive
Base Salary
Long-Term Equity Compensation
CHIEF EXECUTIVE OFFICER
2013 TOTAL DIRECT COMPENSATION
Since a significant portion of Mr. Ersek’s compensation is
both performance-based and “at risk,” we are providing
the following supplemental graph to demonstrate
the difference between the compensation granted to
Mr. Ersek as required to be reported by the SEC rules
in the 2013 Summary Compensation Table, and the
compensation “realizable” by him for 2011 to 2013. For
each of the years reported, the compensation “realizable”
by Mr. Ersek is lower than the amount required to be
reported by the SEC in the Summary Compensation Table.
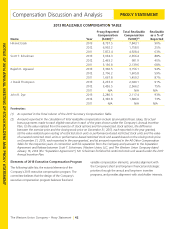
Cash and All Other
Compensation
Equity-Based
Awards
Total Reported
Compensation(2)
201320122011
In $ millions
2013 Chief Executive Officer Total Reported Compensation
Versus Total Realizable Compensation(1)
0
2
4
6
8
10
4.9
2.4
2.5
7.9
7.0
1.8
0.5
1.3
8.8
7.8
5.4
2.4
Total Realizable Compensation(3):
(1) This graph and the total realizable compensation
reported in this graph provides supplemental
information regarding the compensation paid to
Mr. Ersek and should not be viewed as a substitute for
the 2013 Summary Compensation Table.
(2) As reported in the Total column of the 2013 Summary
Compensation Table.
(3) Amounts reported in the calculation of total realizable
compensation include (a) annualized base salary,
(b) actual bonus payments made to Mr. Ersek in each
of the years shown under the Company’s Annual
Incentive Plan, (c) the value realized from the exercise
of stock options and for unexercised stock options,
the difference between the exercise price and the
closing stock price on December 31, 2013, each
reported in the year granted, (d) the value realized
upon vesting of restricted stock units or performance-
based restricted stock units and the value of unvested
restricted stock units or performance-based restricted
stock unit awards based on the closing stock price
on December 31, 2013, each reported in the year
granted, and (e) amounts reported in the All Other
Compensation Table for the respective years.