Western Union 2013 Annual Report Download - page 16
Download and view the complete annual report
Please find page 16 of the 2013 Western Union annual report below. You can navigate through the pages in the report by either clicking on the pages listed below, or by using the keyword search tool below to find specific information within the annual report.-
 1
1 -
2
-
3
-
4
-
5
-
 6
6 -
 7
7 -
 8
8 -
 9
9 -
 10
10 -
 11
11 -
 12
12 -
 13
13 -
 14
14 -
 15
15 -
 16
16 -
 17
17 -
 18
18 -
 19
19 -
 20
20 -
 21
21 -
 22
22 -
 23
23 -
 24
24 -
 25
25 -
 26
26 -
27
-
28
-
29
-
30
-
31
-
32
-
33
-
34
-
35
-
36
-
37
-
38
-
39
-
40
-
41
-
42
-
43
-
44
-
45
-
46
-
47
-
48
-
49
-
50
-
51
-
52
-
53
-
54
-
55
-
56
-
57
-
58
-
59
-
60
-
61
-
62
-
63
-
64
-
65
-
66
-
67
-
68
-
69
-
70
-
71
-
72
-
73
-
74
-
75
-
76
-
77
-
78
-
79
-
80
-
81
-
82
-
83
-
84
-
85
-
86
-
87
-
88
-
89
-
90
-
91
-
92
-
93
-
94
-
95
-
96
-
97
-
98
-
99
-
100
-
101
-
102
-
103
-
104
-
105
-
106
-
107
-
108
-
109
-
110
-
111
-
112
-
113
-
114
-
115
-
116
-
117
-
118
-
119
-
120
-
121
-
122
-
123
-
124
-
125
-
126
-
127
-
128
-
129
-
130
-
131
-
132
-
133
-
134
-
135
-
136
-
137
-
138
-
139
-
140
-
141
-
142
-
143
-
144
-
145
-
146
-
147
-
148
-
149
-
150
-
151
-
152
-
153
-
154
-
155
-
156
-
157
-
158
-
159
-
160
-
161
-
162
-
163
-
164
-
165
-
166
-
167
-
168
-
169
-
170
-
171
-
172
-
173
-
174
-
175
-
176
-
177
-
178
-
179
-
180
-
181
-
182
-
183
-
184
-
185
-
186
-
187
-
188
-
189
-
190
-
191
-
192
-
193
-
194
-
195
-
196
-
197
-
198
-
199
-
200
-
201
-
202
-
203
-
204
-
205
-
206
-
207
-
208
-
209
-
210
-
211
-
212
-
213
-
214
-
215
-
216
-
217
-
218
-
219
-
220
-
221
-
222
-
223
-
224
-
225
-
226
-
227
-
228
-
229
-
230
-
231
-
232
-
233
-
234
-
235
-
236
-
237
-
238
-
239
-
240
-
241
-
242
-
243
-
244
-
245
-
246
-
247
-
248
-
249
-
250
-
251
-
252
-
253
-
254
-
255
-
256
-
257
-
258
-
259
-
260
-
261
-
262
-
263
-
264
-
265
-
266
-
267
-
268
-
269
-
270
-
271
-
272
-
273
-
274
 |
 |

The Western Union Company – Proxy Statement | iv
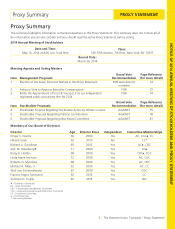
Proxy Summary PROXY STATEMENT
NOTICE OF 2014 ANNUAL MEETING OF STOCKHOLDERS AND PROXY STATEMENT
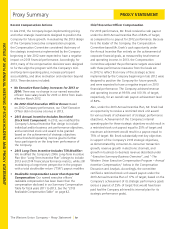
Recent Compensation Actions
In late 2012, the Company began implementing pricing
and other strategic investments designed to position the
Company for future growth. In evaluating the 2013 design
of the Company’s executive compensation program,
the Compensation Committee considered that many of
the strategic investments implemented by the Company
beginning in late 2012 were expected to have a negative
impact on 2013 financial performance. Accordingly, for
2013, many of the compensation decisions were designed
to further align the program with the Company’s mid-
and long-term operating plans, increase participant
accountability, and drive motivation and retention beyond
2013. These decisions included:
• No Executive Base Salary Increases for 2013 or
2014: There was no change in our named executive
officers’ base salary levels for 2013 or 2014 from levels
effective March 2012.
• No 2012 Chief Executive Officer Bonus: Based
on 2012 Company performance, our Chief Executive
Officer did not receive a bonus in 2013.
• 2013 Annual Incentive Includes Restricted
Stock Unit Component: In 2013, we modified the
Company’s Annual Incentive Plan design to include
individual and/or business unit performance objectives,
and a restricted stock unit award to be granted
based on the achievement of strategic objectives
and a threshold operating income goal to further
focus participants on the long-term performance of
the Company.
• 2013 Long-Term Incentive Includes TSR Modifier:
We modified the Company’s 2006 Long-Term Incentive
Plan (the ”Long-Term Incentive Plan”) design to include
2013 and 2014 financial performance metrics, while still
maintaining a longer-term perspective in the program
with a total stockholder return (“TSR”) payout modifier.
• Realizable Compensation Lower than Reported
Compensation: Our named executive officers’
realizable compensation has been lower than the
compensation disclosed in our Summary Compensation
Table for fiscal years 2011 to 2013. See the “2013
Realizable Compensation Table” on page 42.
Chief Executive Officer Compensation
For 2013 performance, Mr. Ersek received a cash payout
under the 2013 Annual Incentive Plan of 84% of target,
as compared to no payout for 2012 performance. Because
he is the leader of the Company, the Compensation
Committee based Mr. Ersek’s cash opportunity under
the Annual Incentive Plan entirely on the achievement of
corporate financial goals, as measured by total revenue
and operating income. In 2013, the Compensation
Committee adjusted the performance targets associated
with these performance measures from the levels set
in 2012 to reflect that many of the strategic actions
implemented by the Company beginning in late 2012 were
designed to position the Company for future growth,
and were expected to have a negative impact on 2013
financial performance. The Company achieved revenue
and operating income at 99.5% and 10 0.1% of target,
respectively, for an overall cash payout achievement level
of 84%.
Also, under the 2013 Annual Incentive Plan, Mr. Ersek had
an opportunity to receive a restricted stock unit award
for various levels of achievement of strategic performance
objectives. Achievement of the Company’s internal
operating plan for these strategic objectives would result in
a restricted stock unit payout equal to 25% of target and
maximum achievement would result in a payout equal to
75% of target. Mr. Ersek substantially met key objectives
in support of the Company’s 2013 strategic objectives,
as demonstrated by consumer-to-consumer transaction
growth, revenue growth in electronic channels, and
growth in business-to-business revenue described under
“-Executive Summary-Business Overview”, and “-The
Western Union Executive Compensation Program – Annual
Incentive Compensation,” below in the Compensation
Discussion and Analysis. Accordingly, the committee
certified a restricted stock unit award payout under the
2013 Annual Incentive Plan of 17% of target, based on the
Company’s achievement of its strategic performance goals
(versus a payout of 25% of target that would have been
paid had the Company achieved its internal plan for its
strategic performance goals).