Western Union 2013 Annual Report Download - page 223
Download and view the complete annual report
Please find page 223 of the 2013 Western Union annual report below. You can navigate through the pages in the report by either clicking on the pages listed below, or by using the keyword search tool below to find specific information within the annual report.-
 1
1 -
2
-
3
-
4
-
5
-
6
-
7
-
8
-
9
-
10
-
11
-
12
-
13
-
14
-
15
-
16
-
17
-
18
-
19
-
20
-
21
-
22
-
23
-
24
-
25
-
26
-
27
-
28
-
29
-
30
-
31
-
32
-
33
-
34
-
35
-
36
-
37
-
38
-
39
-
40
-
41
-
42
-
43
-
44
-
45
-
46
-
47
-
48
-
49
-
50
-
51
-
52
-
53
-
54
-
55
-
56
-
57
-
58
-
59
-
60
-
61
-
62
-
63
-
64
-
65
-
66
-
67
-
68
-
69
-
70
-
71
-
72
-
73
-
74
-
75
-
76
-
77
-
78
-
79
-
80
-
81
-
82
-
83
-
84
-
85
-
86
-
87
-
88
-
89
-
90
-
91
-
92
-
93
-
94
-
95
-
96
-
97
-
98
-
99
-
100
-
101
-
102
-
103
-
104
-
105
-
106
-
107
-
108
-
109
-
110
-
111
-
112
-
113
-
114
-
115
-
116
-
117
-
118
-
119
-
120
-
121
-
122
-
123
-
124
-
125
-
126
-
127
-
128
-
129
-
130
-
131
-
132
-
133
-
134
-
135
-
136
-
137
-
138
-
139
-
140
-
141
-
142
-
143
-
144
-
145
-
146
-
147
-
148
-
149
-
150
-
151
-
152
-
153
-
154
-
155
-
156
-
157
-
158
-
159
-
160
-
161
-
162
-
163
-
164
-
165
-
166
-
167
-
168
-
169
-
170
-
171
-
172
-
173
-
174
-
175
-
176
-
177
-
178
-
179
-
180
-
181
-
182
-
183
-
184
-
185
-
186
-
187
-
188
-
189
-
190
-
191
-
192
-
193
-
194
-
195
-
196
-
197
-
198
-
199
-
200
-
201
-
202
-
203
-
204
-
205
-
206
-
207
-
208
-
209
-
210
-
211
-
212
-
 213
213 -
 214
214 -
 215
215 -
 216
216 -
 217
217 -
 218
218 -
 219
219 -
 220
220 -
 221
221 -
 222
222 -
 223
223 -
 224
224 -
 225
225 -
 226
226 -
 227
227 -
 228
228 -
 229
229 -
 230
230 -
 231
231 -
 232
232 -
 233
233 -
234
-
235
-
236
-
237
-
238
-
239
-
240
-
241
-
242
-
243
-
244
-
245
-
246
-
247
-
248
-
249
-
250
-
251
-
252
-
253
-
254
-
255
-
256
-
257
-
258
-
259
-
260
-
261
-
262
-
263
-
264
-
265
-
266
-
267
-
268
-
269
-
270
-
271
-
272
-
273
-
274
 |
 |

2013 FORM 10-K
THE WESTERN UNION COMPANY
NOTES TO CONSOLIDATED FINANCIAL STATEMENTS (Continued)
113
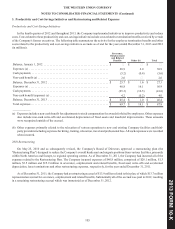
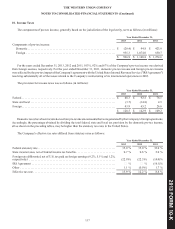
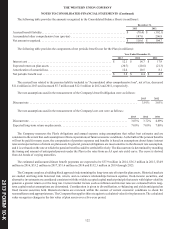
6. Related Party Transactions
The Company has ownership interests in certain of its agents accounted for under the equity method of accounting. The
Company pays these agents, as it does its other agents, commissions for money transfer and other services provided on the
Company's behalf. Commission expense recognized for these agents for the years ended December 31, 2013, 2012 and 2011 totaled
$65.5 million, $66.1 million and $131.9 million, respectively. Commission expense recognized for Finint prior to October 31,
2011 and Costa prior to April 20, 2011, the date of the acquisitions (see Note 4), was considered a related party transaction.
The Company has a director who is also a director for a company that previously held significant investments in two of the
Company's existing agents. During the first quarter of 2012, this company sold its interest in one of these agents, so that for the
year ended December 31, 2013, this company held a significant investment in only one agent. These agents had been agents of
the Company prior to the director being appointed to the board. The Company recognized commission expense of $15.1 million,
$28.9 million and $58.8 million for the years ended December 31, 2013, 2012 and 2011, respectively, related to these agents during
the periods the agents were affiliated with the Company's director. In January 2014, this director advised the Company that he
does not intend to stand for re-election as a director at the Company's 2014 annual meeting of stockholders.
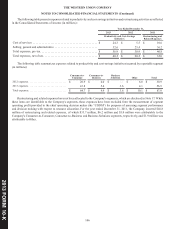
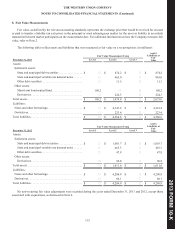
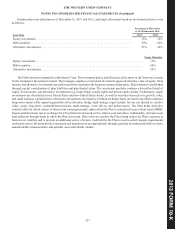
7. Investment Securities
Investment securities included in "Settlement assets" in the Consolidated Balance Sheets consist primarily of highly-rated
state and municipal debt securities, including variable rate demand notes. Variable rate demand note securities can be put (sold at
par) typically on a daily basis with settlement periods ranging from the same day to one week, but have varying maturities through
2051. Generally, these securities are used by the Company for short-term liquidity needs and are held for short periods of time,
typically less than 30 days. The Company is required to hold specific highly-rated, investment grade securities and such investments
are restricted to satisfy outstanding settlement obligations in accordance with applicable state and foreign country requirements.
During the third quarter of 2013, the Company invested in a short-term bond mutual fund which holds a diversified portfolio
of fixed income securities, with a combined average maturity of less than one year. This investment can be redeemed daily. The
fair value of this investment, which is included in "Other assets" in the Company's Consolidated Balance Sheets, was $100.2
million as of December 31, 2013.
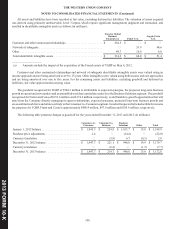
The substantial majority of the Company's investment securities are classified as available-for-sale and recorded at fair value.
Investment securities are exposed to market risk due to changes in interest rates and credit risk. Western Union regularly monitors
credit risk and attempts to mitigate its exposure by investing in highly-rated securities and through investment diversification. As
of December 31, 2013, the majority of the Company's investment securities had credit ratings of "AA-" or better from a major
credit rating agency.
Unrealized gains and losses on available-for-sale securities are excluded from earnings and presented as a component of
accumulated other comprehensive income or loss, net of related deferred taxes. Proceeds from the sale and maturity of available-
for-sale securities during the years ended December 31, 2013, 2012 and 2011 were $19.0 billion, $16.3 billion and $14.2 billion,
respectively.
Gains and losses on investments are calculated using the specific-identification method and are recognized during the period
in which the investment is sold or when an investment experiences an other-than-temporary decline in value. Factors that could
indicate an impairment exists include, but are not limited to: earnings performance, changes in credit rating or adverse changes in
the regulatory or economic environment of the asset. If potential impairment exists, the Company assesses whether it has the intent
to sell the debt security, more likely than not will be required to sell the debt security before its anticipated recovery or expects
that some of the contractual cash flows will not be received. The Company had no material other-than-temporary impairments
during the periods presented.