Western Union 2013 Annual Report Download - page 176
Download and view the complete annual report
Please find page 176 of the 2013 Western Union annual report below. You can navigate through the pages in the report by either clicking on the pages listed below, or by using the keyword search tool below to find specific information within the annual report.-
 1
1 -
2
-
3
-
4
-
5
-
6
-
7
-
8
-
9
-
10
-
11
-
12
-
13
-
14
-
15
-
16
-
17
-
18
-
19
-
20
-
21
-
22
-
23
-
24
-
25
-
26
-
27
-
28
-
29
-
30
-
31
-
32
-
33
-
34
-
35
-
36
-
37
-
38
-
39
-
40
-
41
-
42
-
43
-
44
-
45
-
46
-
47
-
48
-
49
-
50
-
51
-
52
-
53
-
54
-
55
-
56
-
57
-
58
-
59
-
60
-
61
-
62
-
63
-
64
-
65
-
66
-
67
-
68
-
69
-
70
-
71
-
72
-
73
-
74
-
75
-
76
-
77
-
78
-
79
-
80
-
81
-
82
-
83
-
84
-
85
-
86
-
87
-
88
-
89
-
90
-
91
-
92
-
93
-
94
-
95
-
96
-
97
-
98
-
99
-
100
-
101
-
102
-
103
-
104
-
105
-
106
-
107
-
108
-
109
-
110
-
111
-
112
-
113
-
114
-
115
-
116
-
117
-
118
-
119
-
120
-
121
-
122
-
123
-
124
-
125
-
126
-
127
-
128
-
129
-
130
-
131
-
132
-
133
-
134
-
135
-
136
-
137
-
138
-
139
-
140
-
141
-
142
-
143
-
144
-
145
-
146
-
147
-
148
-
149
-
150
-
151
-
152
-
153
-
154
-
155
-
156
-
157
-
158
-
159
-
160
-
161
-
162
-
163
-
164
-
165
-
 166
166 -
 167
167 -
 168
168 -
 169
169 -
 170
170 -
 171
171 -
 172
172 -
 173
173 -
 174
174 -
 175
175 -
 176
176 -
 177
177 -
 178
178 -
 179
179 -
 180
180 -
 181
181 -
 182
182 -
 183
183 -
 184
184 -
 185
185 -
 186
186 -
187
-
188
-
189
-
190
-
191
-
192
-
193
-
194
-
195
-
196
-
197
-
198
-
199
-
200
-
201
-
202
-
203
-
204
-
205
-
206
-
207
-
208
-
209
-
210
-
211
-
212
-
213
-
214
-
215
-
216
-
217
-
218
-
219
-
220
-
221
-
222
-
223
-
224
-
225
-
226
-
227
-
228
-
229
-
230
-
231
-
232
-
233
-
234
-
235
-
236
-
237
-
238
-
239
-
240
-
241
-
242
-
243
-
244
-
245
-
246
-
247
-
248
-
249
-
250
-
251
-
252
-
253
-
254
-
255
-
256
-
257
-
258
-
259
-
260
-
261
-
262
-
263
-
264
-
265
-
266
-
267
-
268
-
269
-
270
-
271
-
272
-
273
-
274
 |
 |

2013 FORM 10-K
66
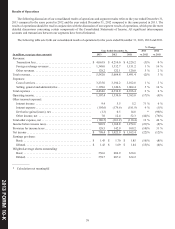
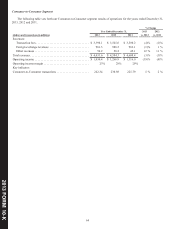
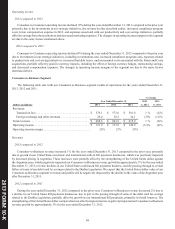
Transaction fees and foreign exchange revenues
2013 compared to 2012
For the year ended December 31, 2013 compared to the prior year, Consumer-to-Consumer money transfer revenue declined
3% primarily due to price reductions and compliance related actions in various corridors. Transactions increased 5% from 2012,
primarily due to price reductions. Our consumers transferred $82 billion and $79 billion in Consumer-to-Consumer principal for
the years ended December 31, 2013 and 2012, respectively, of which $74 billion and $71 billion related to cross-border principal,
respectively, which represented increases of 3% and 4% for Consumer-to-Consumer principal and cross-border principal over the
prior year, respectively.
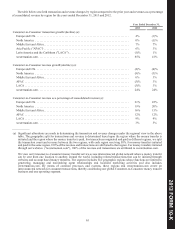
Beginning in the fourth quarter of 2012, we implemented additional fee reductions and actions to adjust foreign exchange
spreads that have impacted approximately 25% of our Consumer-to-Consumer business, based on 2012 revenue. We had initiated
substantially all of these pricing reductions as of June 30, 2013. Pricing reductions generally reduce margins and adversely affect
financial results in the short term, but are done in anticipation that they will result in increased transaction volumes which may
lead to increased revenues and operating income in the affected corridors thereafter. These pricing actions totaled approximately
5% of consolidated revenue and 7% of our Consumer-to-Consumer revenue, for the full year 2013.
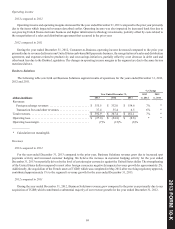
The regions discussed below were impacted by price reductions in certain key corridors and compliance related actions in
various corridors.
For the year ended December 31, 2013 compared to the prior year, revenue in our Europe and CIS region decreased 4% on
transaction growth of 4%. Revenue was negatively impacted by price reductions, compliance related actions in various countries,
including in the United Kingdom and Spain, competitive challenges in Russia, and continued economic softness in Southern
Europe, partially offset by revenue growth in Germany.
For the year ended December 31, 2013 compared to the prior year, our North America region experienced revenue declines
of 9% on flat transactions. Our North America region was impacted by our Mexico business, where revenue declined due to price
reductions and compliance related actions resulting from our agreement and settlement with the State of Arizona and changes to
our business model, primarily for our Vigo® and Orlandi ValutaSM brands. These changes resulted in the loss of over 7,000 agent
locations in the third quarter of 2012. Transactions increased in our Mexico business for the year ended December 31, 2013,
primarily due to price reductions, partially offset by the impact of compliance related actions described earlier in this paragraph.
Our North America region was also impacted by our United States outbound business, which also experienced a decline in revenue
due to price reductions and compliance related actions resulting from our agreement and settlement with the State of Arizona and
changes to our business model, primarily impacting our Vigo brand to Latin America, and other compliance related actions.
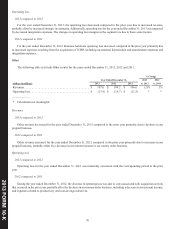
For the year ended December 31, 2013 compared to the prior year, our Middle East and Africa and APAC regions experienced
flat revenue and a revenue decline of 3%, respectively. Both regions experienced transaction growth in the year ended December
31, 2013 compared to the prior year. The differential between revenue and transaction changes for both regions was primarily
attributable to price reductions.
Our LACA region experienced revenue declines for the year ended December 31, 2013 compared to the prior year due to
compliance related actions resulting from our agreement and settlement with the State of Arizona and changes to our business
model, primarily impacting our Vigo brand, and other compliance related actions. Revenue was also negatively impacted by pricing
actions and the strengthening of the United States dollar compared to most other foreign currencies in the region, partially offset
by geographic and product mix. Transactions decreased for the year ended December 31, 2013 compared to the prior year, primarily
due to the impact of compliance related actions described earlier, partially offset by price reductions. We expect that the United
States dollar value of our LACA region's revenue and profits will be negatively impacted by the decline in the value of the Argentine
peso after December 31, 2013.