Western Union 2013 Annual Report Download - page 68
Download and view the complete annual report
Please find page 68 of the 2013 Western Union annual report below. You can navigate through the pages in the report by either clicking on the pages listed below, or by using the keyword search tool below to find specific information within the annual report.-
 1
1 -
2
-
3
-
4
-
5
-
6
-
7
-
8
-
9
-
10
-
11
-
12
-
13
-
14
-
15
-
16
-
17
-
18
-
19
-
20
-
21
-
22
-
23
-
24
-
25
-
26
-
27
-
28
-
29
-
30
-
31
-
32
-
33
-
34
-
35
-
36
-
37
-
38
-
39
-
40
-
41
-
42
-
43
-
44
-
45
-
46
-
47
-
48
-
49
-
50
-
51
-
52
-
53
-
54
-
55
-
56
-
57
-
 58
58 -
 59
59 -
 60
60 -
 61
61 -
 62
62 -
 63
63 -
 64
64 -
 65
65 -
 66
66 -
 67
67 -
 68
68 -
 69
69 -
 70
70 -
 71
71 -
 72
72 -
 73
73 -
 74
74 -
 75
75 -
 76
76 -
 77
77 -
 78
78 -
79
-
80
-
81
-
82
-
83
-
84
-
85
-
86
-
87
-
88
-
89
-
90
-
91
-
92
-
93
-
94
-
95
-
96
-
97
-
98
-
99
-
100
-
101
-
102
-
103
-
104
-
105
-
106
-
107
-
108
-
109
-
110
-
111
-
112
-
113
-
114
-
115
-
116
-
117
-
118
-
119
-
120
-
121
-
122
-
123
-
124
-
125
-
126
-
127
-
128
-
129
-
130
-
131
-
132
-
133
-
134
-
135
-
136
-
137
-
138
-
139
-
140
-
141
-
142
-
143
-
144
-
145
-
146
-
147
-
148
-
149
-
150
-
151
-
152
-
153
-
154
-
155
-
156
-
157
-
158
-
159
-
160
-
161
-
162
-
163
-
164
-
165
-
166
-
167
-
168
-
169
-
170
-
171
-
172
-
173
-
174
-
175
-
176
-
177
-
178
-
179
-
180
-
181
-
182
-
183
-
184
-
185
-
186
-
187
-
188
-
189
-
190
-
191
-
192
-
193
-
194
-
195
-
196
-
197
-
198
-
199
-
200
-
201
-
202
-
203
-
204
-
205
-
206
-
207
-
208
-
209
-
210
-
211
-
212
-
213
-
214
-
215
-
216
-
217
-
218
-
219
-
220
-
221
-
222
-
223
-
224
-
225
-
226
-
227
-
228
-
229
-
230
-
231
-
232
-
233
-
234
-
235
-
236
-
237
-
238
-
239
-
240
-
241
-
242
-
243
-
244
-
245
-
246
-
247
-
248
-
249
-
250
-
251
-
252
-
253
-
254
-
255
-
256
-
257
-
258
-
259
-
260
-
261
-
262
-
263
-
264
-
265
-
266
-
267
-
268
-
269
-
270
-
271
-
272
-
273
-
274
 |
 |

Compensation Discussion and Analysis PROXY STATEMENT
The Western Union Company – Proxy Statement | 50
NOTICE OF 2014 ANNUAL MEETING OF STOCKHOLDERS AND PROXY STATEMENT
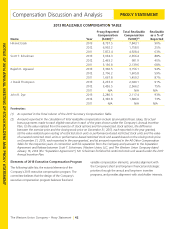
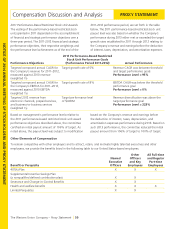
2011 Performance-Based Restricted Stock Unit Awards.
The vesting of the performance-based restricted stock
units granted in 2011 depended on the accomplishment
of financial and strategic performance objectives over a
three-year period. The 2011-2012 financial and strategic
performance objectives, their respective weightings and
the performance level achievement as of the end of the
2011-2012 performance period, are set forth in the table
below. The 2011 performance-based restricted stock unit
payout level was also based on whether the Company’s
performance during 2013 either met or exceeded the target
growth rates established for 2011 through 2012 relating to
the Company’s revenue and earnings before the deduction
of interest, taxes, depreciation, and amortization expenses.
Performance Objectives
2011 Performance-Based Restricted
Stock Unit Performance Goals
(Performance Period 2011-2012) Actual Performance
Targeted compound annual CAGR for
the Company’s revenue for 2011–2012,
measured against 2010 revenue
(weighted ¹⁄³)
Target growth rate of 5% Revenue CAGR was between threshold
and target performance goals
Performance Level = 95%
Targeted compound annual CAGR for
the Company’s EBITDA for 2011–2012,
measured against 2010 EBITDA
(weighted ¹⁄³)
Target growth rate of 8% EBITDA CAGR was below the threshold
performance goal
Performance Level = 0%
Targeted 2012 revenue from
electronic channels, prepaid services,
and business-to-business services
(weighted ¹⁄³)
Target performance level
of $400M
Revenue diversification was above the
target performance goal
Performance Level = 223%
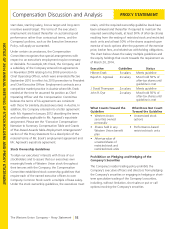
Based on management’s performance levels relative to
the 2011 performance-based restricted stock unit award
performance objectives described above, the committee
certified an initial payout amount of 106% of target. As
noted above, the payout level was subject to modification
based on the Company’s revenue and earnings before
the deduction of interest, taxes, depreciation, and
amortization expenses performance during 2013. Based on
such 2013 performance, the committee reduced the initial
payout amount from 106% of target to 100% of target.
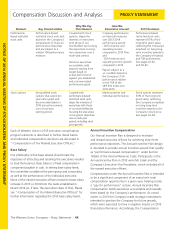
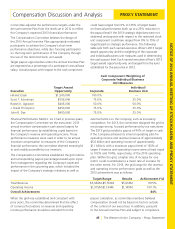
Other Elements of Compensation
To remain competitive with other employers and to attract, retain, and motivate highly talented executives and other
employees, we provide the benefits listed in the following table to our United States-based employees:
Benefit or Perquisite
Named
Executive
Officers
Other
Officers
and Key
Employees
All Full-time
and Regular
Part-time
Employees
401(k) Plan X X X
Supplemental Incentive Savings Plan
(a nonqualified defined contribution plan) X X
Severance and Change-in-Control Benefits X X
Health and welfare benefits X X X
Limited Perquisites X X