Western Union 2013 Annual Report Download - page 63
Download and view the complete annual report
Please find page 63 of the 2013 Western Union annual report below. You can navigate through the pages in the report by either clicking on the pages listed below, or by using the keyword search tool below to find specific information within the annual report.-
 1
1 -
2
-
3
-
4
-
5
-
6
-
7
-
8
-
9
-
10
-
11
-
12
-
13
-
14
-
15
-
16
-
17
-
18
-
19
-
20
-
21
-
22
-
23
-
24
-
25
-
26
-
27
-
28
-
29
-
30
-
31
-
32
-
33
-
34
-
35
-
36
-
37
-
38
-
39
-
40
-
41
-
42
-
43
-
44
-
45
-
46
-
47
-
48
-
49
-
50
-
51
-
52
-
 53
53 -
 54
54 -
 55
55 -
 56
56 -
 57
57 -
 58
58 -
 59
59 -
 60
60 -
 61
61 -
 62
62 -
 63
63 -
 64
64 -
 65
65 -
 66
66 -
 67
67 -
 68
68 -
 69
69 -
 70
70 -
 71
71 -
 72
72 -
 73
73 -
74
-
75
-
76
-
77
-
78
-
79
-
80
-
81
-
82
-
83
-
84
-
85
-
86
-
87
-
88
-
89
-
90
-
91
-
92
-
93
-
94
-
95
-
96
-
97
-
98
-
99
-
100
-
101
-
102
-
103
-
104
-
105
-
106
-
107
-
108
-
109
-
110
-
111
-
112
-
113
-
114
-
115
-
116
-
117
-
118
-
119
-
120
-
121
-
122
-
123
-
124
-
125
-
126
-
127
-
128
-
129
-
130
-
131
-
132
-
133
-
134
-
135
-
136
-
137
-
138
-
139
-
140
-
141
-
142
-
143
-
144
-
145
-
146
-
147
-
148
-
149
-
150
-
151
-
152
-
153
-
154
-
155
-
156
-
157
-
158
-
159
-
160
-
161
-
162
-
163
-
164
-
165
-
166
-
167
-
168
-
169
-
170
-
171
-
172
-
173
-
174
-
175
-
176
-
177
-
178
-
179
-
180
-
181
-
182
-
183
-
184
-
185
-
186
-
187
-
188
-
189
-
190
-
191
-
192
-
193
-
194
-
195
-
196
-
197
-
198
-
199
-
200
-
201
-
202
-
203
-
204
-
205
-
206
-
207
-
208
-
209
-
210
-
211
-
212
-
213
-
214
-
215
-
216
-
217
-
218
-
219
-
220
-
221
-
222
-
223
-
224
-
225
-
226
-
227
-
228
-
229
-
230
-
231
-
232
-
233
-
234
-
235
-
236
-
237
-
238
-
239
-
240
-
241
-
242
-
243
-
244
-
245
-
246
-
247
-
248
-
249
-
250
-
251
-
252
-
253
-
254
-
255
-
256
-
257
-
258
-
259
-
260
-
261
-
262
-
263
-
264
-
265
-
266
-
267
-
268
-
269
-
270
-
271
-
272
-
273
-
274
 |
 |

45 | The Western Union Company – Proxy Statement
NOTICE OF 2014 ANNUAL MEETING OF STOCKHOLDERS AND PROXY STATEMENT
Compensation Discussion and Analysis PROXY STATEMENT
Committee adjusted the performance targets under the
Annual Incentive Plan from the levels set in 2012 to reflect
the Company’s expected 2013 financial performance.
The Compensation Committee believes the design of
the 2013 Annual Incentive Plan appropriately motivated
participants to achieve the Company’s short-term
performance objectives, while also focusing participants
on the long-term performance of the Company through
the use of the restricted stock unit award.
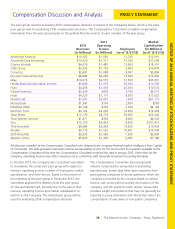
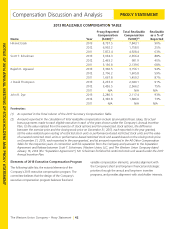
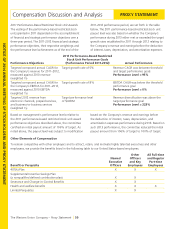
Target payout opportunities under the Annual Incentive Plan
are expressed as a percentage of a participant’s annual base
salary. Actual payouts with respect to the cash component
could have ranged from 0% to 125% of target based
on financial performance (with up to a 25% reduction in
the payout level if the 2013 strategic objectives were not
obtained) and payouts with respect to the restricted stock
unit component could have ranged from 0% to 75% of
target based on strategic performance. The following
table sets forth each named executive officer’s 2013 target
award opportunity and the weighting of the corporate
and individual/business unit measures used in determining
the cash payout level. Each named executive officer’s 2013
target award opportunity was unchanged from the level
established for the executive in 2012.
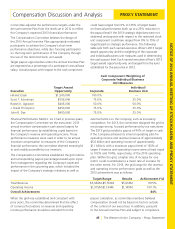
Cash Component: Weighting of
Corporate/Individual/Business
Unit Measures
Executive
Target Award
Opportunity Corporate
Individual/
Business Unit
Hikmet Ersek $1,500,000 100.0% —
Scott T. Scheirman $556,046 75.0% 25.0%
Rajesh K. Agrawal $405,000 50.0% 50.0%
J. David Thompson $450,000 75.0% 25.0%
John R. Dye $400,000 75.0% 25.0%
Financial Performance Metrics. As it had in previous years,
the Compensation Committee set the executives’ 2013
annual incentive compensation cash award targets for
financial performance by establishing a grid based on
the Company’s revenue and operating income. These
performance measures were used in order to tie annual
incentive compensation to measures of the Company’s
financial performance the committee deemed meaningful
to and readily accessible by our investors.
The Compensation Committee established the grid metrics
and corresponding payout percentages based upon input
from management regarding the Company’s expected
performance in the upcoming year, which included the
impact of the Company’s strategic initiatives as well as
external factors on the Company, such as increasing
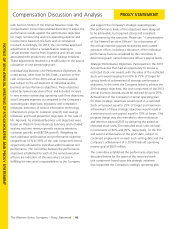
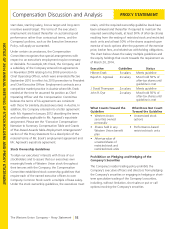
competition. For 2013, the committee designed the grid to
encourage strong, focused performance by our executives.
The 2013 grid provided a payout of 90% of target in cash
if the Company achieved its internal operating plan for
operating income and revenue (revenue of approximately
$5.6 billion and operating income of approximately
$1.1 billion), with a maximum payout level of 125% of
target if revenue and operating income were at least equal
to 102% and 104%, respectively, of the 2013 operating
plan. Within the grid, a higher rate of increase for one
metric could counterbalance a lower rate of increase for
the other metric. For 2013, the grid range for the revenue
and operating income performance goals as well as the
2013 achievement was as follows:
Target Range Results Achievement (%)
Total Revenue $5,466M-$5,760M $5,618M 99.5%
Operating Income $1,075M-$1,194M $1,149M 100.1%
Overall Achievement 84%
When the grid was established and consistent with
prior years, the committee determined that the effect
of currency fluctuations on revenue and operating
income performance should be excluded from the
payout calculation, as committee members believed
compensation should not be based on factors outside
of the control of our executives. In addition, pursuant
to the Annual Incentive Plan and subject to compliance