Western Union 2013 Annual Report Download - page 178
Download and view the complete annual report
Please find page 178 of the 2013 Western Union annual report below. You can navigate through the pages in the report by either clicking on the pages listed below, or by using the keyword search tool below to find specific information within the annual report.-
 1
1 -
2
-
3
-
4
-
5
-
6
-
7
-
8
-
9
-
10
-
11
-
12
-
13
-
14
-
15
-
16
-
17
-
18
-
19
-
20
-
21
-
22
-
23
-
24
-
25
-
26
-
27
-
28
-
29
-
30
-
31
-
32
-
33
-
34
-
35
-
36
-
37
-
38
-
39
-
40
-
41
-
42
-
43
-
44
-
45
-
46
-
47
-
48
-
49
-
50
-
51
-
52
-
53
-
54
-
55
-
56
-
57
-
58
-
59
-
60
-
61
-
62
-
63
-
64
-
65
-
66
-
67
-
68
-
69
-
70
-
71
-
72
-
73
-
74
-
75
-
76
-
77
-
78
-
79
-
80
-
81
-
82
-
83
-
84
-
85
-
86
-
87
-
88
-
89
-
90
-
91
-
92
-
93
-
94
-
95
-
96
-
97
-
98
-
99
-
100
-
101
-
102
-
103
-
104
-
105
-
106
-
107
-
108
-
109
-
110
-
111
-
112
-
113
-
114
-
115
-
116
-
117
-
118
-
119
-
120
-
121
-
122
-
123
-
124
-
125
-
126
-
127
-
128
-
129
-
130
-
131
-
132
-
133
-
134
-
135
-
136
-
137
-
138
-
139
-
140
-
141
-
142
-
143
-
144
-
145
-
146
-
147
-
148
-
149
-
150
-
151
-
152
-
153
-
154
-
155
-
156
-
157
-
158
-
159
-
160
-
161
-
162
-
163
-
164
-
165
-
166
-
167
-
 168
168 -
 169
169 -
 170
170 -
 171
171 -
 172
172 -
 173
173 -
 174
174 -
 175
175 -
 176
176 -
 177
177 -
 178
178 -
 179
179 -
 180
180 -
 181
181 -
 182
182 -
 183
183 -
 184
184 -
 185
185 -
 186
186 -
 187
187 -
 188
188 -
189
-
190
-
191
-
192
-
193
-
194
-
195
-
196
-
197
-
198
-
199
-
200
-
201
-
202
-
203
-
204
-
205
-
206
-
207
-
208
-
209
-
210
-
211
-
212
-
213
-
214
-
215
-
216
-
217
-
218
-
219
-
220
-
221
-
222
-
223
-
224
-
225
-
226
-
227
-
228
-
229
-
230
-
231
-
232
-
233
-
234
-
235
-
236
-
237
-
238
-
239
-
240
-
241
-
242
-
243
-
244
-
245
-
246
-
247
-
248
-
249
-
250
-
251
-
252
-
253
-
254
-
255
-
256
-
257
-
258
-
259
-
260
-
261
-
262
-
263
-
264
-
265
-
266
-
267
-
268
-
269
-
270
-
271
-
272
-
273
-
274
 |
 |

2013 FORM 10-K
68
Operating income
2013 compared to 2012
Consumer-to-Consumer operating income declined 19% during the year ended December 31, 2013 compared to the prior year
primarily due to the investments in our strategic initiatives, the revenue decline described earlier, increased compliance program
costs, lower compensation expense in 2012, and expenses associated with our productivity and cost savings initiatives, partially
offset by savings from these initiatives and decreased marketing expenses. The changes in operating income margins in the segment
are due to the same factors mentioned above.
2012 compared to 2011
Consumer-to-Consumer operating income declined 4% during the year ended December 31, 2012 compared to the prior year
due to investments in our strategic initiatives, including westernunion.com, increased compliance program costs, expenses related
to productivity and cost-savings initiatives, increased bad debt losses, and incremental costs associated with the Finint and Costa
acquisitions, partially offset by positive currency impacts, including the effect of foreign currency hedges, restructuring savings,
and decreased compensation expenses. The changes in operating income margins in the segment are due to the same factors
mentioned above.
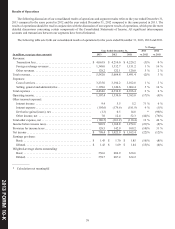
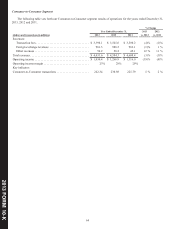
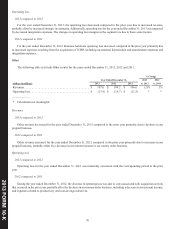
Consumer-to-Business Segment
The following table sets forth our Consumer-to-Business segment results of operations for the years ended December 31,
2013, 2012 and 2011.
% Change
Year Ended December 31, 2013 2012
(dollars in millions) 2013 2012 2011 vs. 2012 vs. 2011
Revenues:
Transaction fees . . . . . . . . . . . . . . . . . . . . . . . . . . . . . . . . . . . . $ 579.1 $ 573.6 $ 581.8 1 % (1)%
Foreign exchange and other revenues . . . . . . . . . . . . . . . . . . . 29.4 30.3 34.1 (3)% (11)%
Total revenues . . . . . . . . . . . . . . . . . . . . . . . . . . . . . . . . . . . . . . . . $ 608.5 $ 603.9 $ 615.9 1 % (2)%
Operating income . . . . . . . . . . . . . . . . . . . . . . . . . . . . . . . . . . . . . $ 121.9 $ 137.6 $ 146.9 (11)% (6)%
Operating income margin . . . . . . . . . . . . . . . . . . . . . . . . . . . . . . . 20% 23% 24%
Revenues
2013 compared to 2012
Consumer-to-Business revenue increased 1% for the year ended December 31, 2013 compared to the prior year, primarily
due to growth in our United States electronic and international walk-in bill payments businesses, which was positively impacted
by increased pricing in Argentina. These increases were partially offset by the strengthening of the United States dollar against
the Argentine peso, which negatively impacted our Consumer-to-Business revenue growth by approximately 5% for the year ended
December 31, 2013, revenue declines in our United States cash-based bill payments business, and the passing through to certain
billers of some of our debit card fee savings related to the Durbin Legislation. We expect that the United States dollar value of our
Consumer-to-Business segment's revenue and profits will be negatively impacted by the decline in the value of the Argentine peso
after December 31, 2013.
2012 compared to 2011
During the year ended December 31, 2012 compared to the prior year, Consumer-to-Business revenue decreased 2% due to
a decline in our United States bill payments businesses, due in part to the passing through of some of the debit card fee savings
related to the Durbin Legislation, partially offset by growth in our international bill payments, primarily in South America. The
strengthening of the United States dollar compared to most other foreign currencies negatively impacted our Consumer-to-Business
revenue growth by approximately 3% for the year ended December 31, 2012.