Western Union 2013 Annual Report Download - page 172
Download and view the complete annual report
Please find page 172 of the 2013 Western Union annual report below. You can navigate through the pages in the report by either clicking on the pages listed below, or by using the keyword search tool below to find specific information within the annual report.-
 1
1 -
2
-
3
-
4
-
5
-
6
-
7
-
8
-
9
-
10
-
11
-
12
-
13
-
14
-
15
-
16
-
17
-
18
-
19
-
20
-
21
-
22
-
23
-
24
-
25
-
26
-
27
-
28
-
29
-
30
-
31
-
32
-
33
-
34
-
35
-
36
-
37
-
38
-
39
-
40
-
41
-
42
-
43
-
44
-
45
-
46
-
47
-
48
-
49
-
50
-
51
-
52
-
53
-
54
-
55
-
56
-
57
-
58
-
59
-
60
-
61
-
62
-
63
-
64
-
65
-
66
-
67
-
68
-
69
-
70
-
71
-
72
-
73
-
74
-
75
-
76
-
77
-
78
-
79
-
80
-
81
-
82
-
83
-
84
-
85
-
86
-
87
-
88
-
89
-
90
-
91
-
92
-
93
-
94
-
95
-
96
-
97
-
98
-
99
-
100
-
101
-
102
-
103
-
104
-
105
-
106
-
107
-
108
-
109
-
110
-
111
-
112
-
113
-
114
-
115
-
116
-
117
-
118
-
119
-
120
-
121
-
122
-
123
-
124
-
125
-
126
-
127
-
128
-
129
-
130
-
131
-
132
-
133
-
134
-
135
-
136
-
137
-
138
-
139
-
140
-
141
-
142
-
143
-
144
-
145
-
146
-
147
-
148
-
149
-
150
-
151
-
152
-
153
-
154
-
155
-
156
-
157
-
158
-
159
-
160
-
161
-
 162
162 -
 163
163 -
 164
164 -
 165
165 -
 166
166 -
 167
167 -
 168
168 -
 169
169 -
 170
170 -
 171
171 -
 172
172 -
 173
173 -
 174
174 -
 175
175 -
 176
176 -
 177
177 -
 178
178 -
 179
179 -
 180
180 -
 181
181 -
 182
182 -
183
-
184
-
185
-
186
-
187
-
188
-
189
-
190
-
191
-
192
-
193
-
194
-
195
-
196
-
197
-
198
-
199
-
200
-
201
-
202
-
203
-
204
-
205
-
206
-
207
-
208
-
209
-
210
-
211
-
212
-
213
-
214
-
215
-
216
-
217
-
218
-
219
-
220
-
221
-
222
-
223
-
224
-
225
-
226
-
227
-
228
-
229
-
230
-
231
-
232
-
233
-
234
-
235
-
236
-
237
-
238
-
239
-
240
-
241
-
242
-
243
-
244
-
245
-
246
-
247
-
248
-
249
-
250
-
251
-
252
-
253
-
254
-
255
-
256
-
257
-
258
-
259
-
260
-
261
-
262
-
263
-
264
-
265
-
266
-
267
-
268
-
269
-
270
-
271
-
272
-
273
-
274
 |
 |

2013 FORM 10-K
62
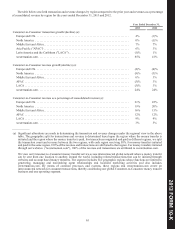
We continue to benefit from a significant proportion of profits being foreign-derived, and generally taxed at lower rates than
our combined federal and state tax rates in the United States. For the years ended December 31, 2013, 2012 and 2011, 103%, 92%
and 67% of our pre-tax income was derived from foreign sources, respectively. For the year ended December 31, 2013, our United
States results were impacted by investments in our strategic initiatives, price reductions implemented in our Consumer-to-Consumer
segment (see the Consumer-to-Consumer "Transaction fees and foreign exchange revenues" discussion below), increased
compliance program costs, and higher interest costs. Our foreign pre-tax income is subject to tax in multiple foreign jurisdictions,
virtually all of which have statutory income tax rates lower than the United States. While the income tax imposed by any one
foreign country is not material to us, our overall effective tax rate could be adversely affected by changes in tax laws, both foreign
and domestic. Certain portions of our foreign source income are subject to United States federal and state income tax as earned
due to the nature of the income, and dividend repatriations of our foreign source income are generally subject to United States
federal and state income tax.
We have established contingency reserves for a variety of material, known tax exposures. As of December 31, 2013, the total
amount of tax contingency reserves was $125.5 million, including accrued interest and penalties, net of related items. Our tax
reserves reflect our judgment as to the resolution of the issues involved if subject to judicial review or other settlement. While we
believe that our reserves are adequate to cover reasonably expected tax risks, there can be no assurance that, in all instances, an
issue raised by a tax authority will be resolved at a financial cost that does not exceed our related reserve. With respect to these
reserves, our income tax expense would include (i) any changes in tax reserves arising from material changes during the period
in facts and circumstances (i.e. new information) surrounding a tax issue and (ii) any difference from our tax position as recorded
in the financial statements and the final resolution of a tax issue during the period. Such resolution could materially increase or
decrease income tax expense in our consolidated financial statements in future periods and could impact our operating cash flows.
Earnings per share
During the years ended December 31, 2013, 2012 and 2011, basic earnings per share were $1.43, $1.70 and $1.85, respectively,
and diluted earnings per share were $1.43, $1.69 and $1.84, respectively. Unvested shares of restricted stock are excluded from
basic shares outstanding. Diluted earnings per share reflects the potential dilution that could occur if outstanding stock options at
the presented dates are exercised and shares of restricted stock have vested. As of December 31, 2013, 2012 and 2011, there were
21.2 million, 23.3 million and 17.1 million, respectively, of outstanding options to purchase shares of Western Union stock excluded
from the diluted earnings per share calculation under the treasury stock method as their effect was anti-dilutive.
Earnings per share decreased for both the year ended December 31, 2013 and 2012 compared to the prior year as a result of
the previously described factors impacting net income, offset by lower weighted-average shares outstanding. The lower number
of shares outstanding was due to stock repurchases exceeding stock option exercises.
•
•
•
•
•