Western Union 2013 Annual Report Download - page 242
Download and view the complete annual report
Please find page 242 of the 2013 Western Union annual report below. You can navigate through the pages in the report by either clicking on the pages listed below, or by using the keyword search tool below to find specific information within the annual report.-
 1
1 -
2
-
3
-
4
-
5
-
6
-
7
-
8
-
9
-
10
-
11
-
12
-
13
-
14
-
15
-
16
-
17
-
18
-
19
-
20
-
21
-
22
-
23
-
24
-
25
-
26
-
27
-
28
-
29
-
30
-
31
-
32
-
33
-
34
-
35
-
36
-
37
-
38
-
39
-
40
-
41
-
42
-
43
-
44
-
45
-
46
-
47
-
48
-
49
-
50
-
51
-
52
-
53
-
54
-
55
-
56
-
57
-
58
-
59
-
60
-
61
-
62
-
63
-
64
-
65
-
66
-
67
-
68
-
69
-
70
-
71
-
72
-
73
-
74
-
75
-
76
-
77
-
78
-
79
-
80
-
81
-
82
-
83
-
84
-
85
-
86
-
87
-
88
-
89
-
90
-
91
-
92
-
93
-
94
-
95
-
96
-
97
-
98
-
99
-
100
-
101
-
102
-
103
-
104
-
105
-
106
-
107
-
108
-
109
-
110
-
111
-
112
-
113
-
114
-
115
-
116
-
117
-
118
-
119
-
120
-
121
-
122
-
123
-
124
-
125
-
126
-
127
-
128
-
129
-
130
-
131
-
132
-
133
-
134
-
135
-
136
-
137
-
138
-
139
-
140
-
141
-
142
-
143
-
144
-
145
-
146
-
147
-
148
-
149
-
150
-
151
-
152
-
153
-
154
-
155
-
156
-
157
-
158
-
159
-
160
-
161
-
162
-
163
-
164
-
165
-
166
-
167
-
168
-
169
-
170
-
171
-
172
-
173
-
174
-
175
-
176
-
177
-
178
-
179
-
180
-
181
-
182
-
183
-
184
-
185
-
186
-
187
-
188
-
189
-
190
-
191
-
192
-
193
-
194
-
195
-
196
-
197
-
198
-
199
-
200
-
201
-
202
-
203
-
204
-
205
-
206
-
207
-
208
-
209
-
210
-
211
-
212
-
213
-
214
-
215
-
216
-
217
-
218
-
219
-
220
-
221
-
222
-
223
-
224
-
225
-
226
-
227
-
228
-
229
-
230
-
231
-
 232
232 -
 233
233 -
 234
234 -
 235
235 -
 236
236 -
 237
237 -
 238
238 -
 239
239 -
 240
240 -
 241
241 -
 242
242 -
 243
243 -
 244
244 -
 245
245 -
 246
246 -
 247
247 -
 248
248 -
 249
249 -
 250
250 -
 251
251 -
 252
252 -
253
-
254
-
255
-
256
-
257
-
258
-
259
-
260
-
261
-
262
-
263
-
264
-
265
-
266
-
267
-
268
-
269
-
270
-
271
-
272
-
273
-
274
 |
 |

2013 FORM 10-K
THE WESTERN UNION COMPANY
NOTES TO CONSOLIDATED FINANCIAL STATEMENTS (Continued)
132
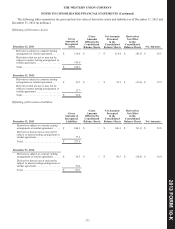
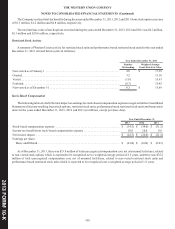
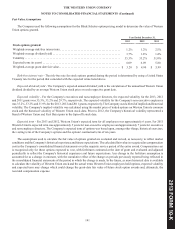
Income Statement
The following tables summarize the location and amount of gains and losses of derivatives in the Consolidated Statements of
Income segregated by designated, qualifying hedging instruments and those that are not, for the years ended December 31, 2013,
2012 and 2011 (in millions):
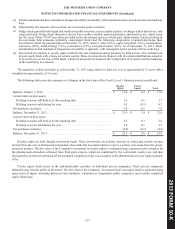
Fair Value Hedges
The following table presents the location and amount of gains/(losses) from fair value hedges for the years ended December 31,
2013, 2012 and 2011 (in millions):
Gain/(Loss) Recognized in Income on
Derivatives
Gain/(Loss) Recognized in Income on
Related Hedged Item (a)
Gain/(Loss) Recognized in Income on
Derivatives (Ineffective Portion and Amount
Excluded from Effectiveness Testing)
Income
Statement
Location
Amount
Income
Statement
Location
Amount
Income
Statement
Location
Amount
Derivatives 2013 2012 2011
Hedged
Item 2013 2012 2011 2013 2012 2011
Interest rate
contracts .
Interest
expense .$ (8.5) $ 3.9 $ 11.8
Fixed-
rate debt.
Interest
expense .$ 19.3 $ 3.7 $ 12.6
Interest
expense .$ — $ — $ —
Total gain/
(loss). . . . . . $ (8.5) $ 3.9 $ 11.8 $ 19.3 $ 3.7 $ 12.6 $ — $ — $ —
Cash Flow Hedges
The following table presents the location and amount of gains/(losses) from cash flow hedges for the years ended December 31,
2013, 2012 and 2011 (in millions):
Gain/(Loss) Recognized Gain/(Loss) Reclassified Gain/(Loss) Recognized in Income on
in OCI on Derivatives from Accumulated OCI into Income Derivatives (Ineffective Portion and Amount
(Effective Portion) (Effective Portion) Excluded from Effectiveness Testing) (b)
Amount Income
Statement
Location
Amount Income
Statement
Location
Amount
Derivatives 2013 2012 2011 2013 2012 2011 2013 2012 2011
Foreign currency
contracts. . . . . $ (3.1) $ (20.1) $ 16.4 Revenue $ 10.4 $ 13.4 $ (30.3)
Derivative
gains/(losses), net $ (0.4) $ (0.1) $ (10.2)
Interest rate
contracts (c) . . — — (21.6) Interest expense (3.6) (3.6) (2.7) Interest expense — — —
Total gain/(loss) . $ (3.1) $ (20.1) $ (5.2) $ 6.8 $ 9.8 $ (33.0) $ (0.4) $ (0.1) $ (10.2)
Undesignated Hedges
The following table presents the location and amount of net gains/(losses) from undesignated hedges for the years ended
December 31, 2013, 2012 and 2011 (in millions):
Gain/(Loss) Recognized in Income on Derivatives (d)
Income Statement Location Amount
Derivatives 2013 2012 2011
Foreign currency contracts (e) . . . . . . . Selling, general and administrative $ (3.7) $ (10.6) $ 5.9
Foreign currency contracts (f) . . . . . . . Derivative gains/(losses), net (0.9) 0.6 21.9
Total gain/(loss) . . . . . . . . . . . . . . . . . . $ (4.6) $ (10.0) $ 27.8
____________________
(a) The 2013 gain of $19.3 million was comprised of a gain in value on the debt of $8.5 million and amortization of hedge
accounting adjustments of $10.8 million. The 2012 gain of $3.7 million was comprised of a loss in value on the debt of
$(3.9) million and amortization of hedge accounting adjustments of $7.6 million. The 2011 gain of $12.6 million was
comprised of a loss in value on the debt of $(11.8) million and amortization of hedge accounting adjustments of $24.4
million.