Western Union 2013 Annual Report Download - page 48
Download and view the complete annual report
Please find page 48 of the 2013 Western Union annual report below. You can navigate through the pages in the report by either clicking on the pages listed below, or by using the keyword search tool below to find specific information within the annual report.-
 1
1 -
2
-
3
-
4
-
5
-
6
-
7
-
8
-
9
-
10
-
11
-
12
-
13
-
14
-
15
-
16
-
17
-
18
-
19
-
20
-
21
-
22
-
23
-
24
-
25
-
26
-
27
-
28
-
29
-
30
-
31
-
32
-
33
-
34
-
35
-
36
-
37
-
 38
38 -
 39
39 -
 40
40 -
 41
41 -
 42
42 -
 43
43 -
 44
44 -
 45
45 -
 46
46 -
 47
47 -
 48
48 -
 49
49 -
 50
50 -
 51
51 -
 52
52 -
 53
53 -
 54
54 -
 55
55 -
 56
56 -
 57
57 -
 58
58 -
59
-
60
-
61
-
62
-
63
-
64
-
65
-
66
-
67
-
68
-
69
-
70
-
71
-
72
-
73
-
74
-
75
-
76
-
77
-
78
-
79
-
80
-
81
-
82
-
83
-
84
-
85
-
86
-
87
-
88
-
89
-
90
-
91
-
92
-
93
-
94
-
95
-
96
-
97
-
98
-
99
-
100
-
101
-
102
-
103
-
104
-
105
-
106
-
107
-
108
-
109
-
110
-
111
-
112
-
113
-
114
-
115
-
116
-
117
-
118
-
119
-
120
-
121
-
122
-
123
-
124
-
125
-
126
-
127
-
128
-
129
-
130
-
131
-
132
-
133
-
134
-
135
-
136
-
137
-
138
-
139
-
140
-
141
-
142
-
143
-
144
-
145
-
146
-
147
-
148
-
149
-
150
-
151
-
152
-
153
-
154
-
155
-
156
-
157
-
158
-
159
-
160
-
161
-
162
-
163
-
164
-
165
-
166
-
167
-
168
-
169
-
170
-
171
-
172
-
173
-
174
-
175
-
176
-
177
-
178
-
179
-
180
-
181
-
182
-
183
-
184
-
185
-
186
-
187
-
188
-
189
-
190
-
191
-
192
-
193
-
194
-
195
-
196
-
197
-
198
-
199
-
200
-
201
-
202
-
203
-
204
-
205
-
206
-
207
-
208
-
209
-
210
-
211
-
212
-
213
-
214
-
215
-
216
-
217
-
218
-
219
-
220
-
221
-
222
-
223
-
224
-
225
-
226
-
227
-
228
-
229
-
230
-
231
-
232
-
233
-
234
-
235
-
236
-
237
-
238
-
239
-
240
-
241
-
242
-
243
-
244
-
245
-
246
-
247
-
248
-
249
-
250
-
251
-
252
-
253
-
254
-
255
-
256
-
257
-
258
-
259
-
260
-
261
-
262
-
263
-
264
-
265
-
266
-
267
-
268
-
269
-
270
-
271
-
272
-
273
-
274
 |
 |

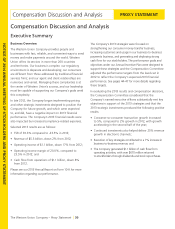
Compensation Discussion and Analysis PROXY STATEMENT
The Western Union Company – Proxy Statement | 30
NOTICE OF 2014 ANNUAL MEETING OF STOCKHOLDERS AND PROXY STATEMENT
Compensation Discussion and Analysis
Executive Summary
Business Overview
The Western Union Company provides people and
businesses with fast, reliable, and convenient ways to send
money and make payments around the world. Western
Union offers its services in more than 200 countries
and territories. Our business is complex: our regulatory
environment is disparate and developing; our consumers
are different from those addressed by traditional financial
services firms; and our agent and client relationships are
numerous and varied. Managing these complexities is at
the center of Western Union’s success, and our leadership
must be capable of supporting our Company’s goals amid
this complexity.
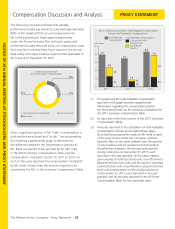
In late 2012, the Company began implementing pricing
and other strategic investments designed to position the
Company for future growth, and which were expected
to, and did, have a negative impact on 2013 financial
performance. The Company’s 2013 financial results were
also impacted by increased compliance-related expenses.
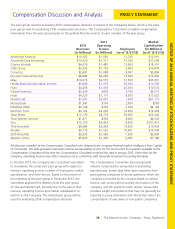
Selected 2013 results are as follows:
• TSR of 30.6% compared to -23.5% in 2012;
• Revenue of $5.5 billion, down 2% from 2012;
• Operating income of $1.1 billion, down 17% from 2012;
• Operating income margin of 20.0%, compared to
23.5% in 2012; and
• Cash flow from operations of $1.1 billion, down 8%
from 2012.
Please see our 2013 Annual Report on Form 10-K for more
information regarding our performance.
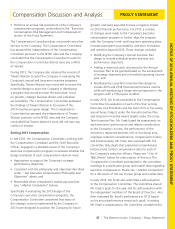
The Company’s 2013 strategies were focused on
strengthening our consumer money transfer business,
increasing customers and usage in our business-to-business
payments business, and generating and deploying strong
cash flow for our stockholders. The performance goals and
objectives under our Annual Incentive Plan were designed to
support these strategies and the Compensation Committee
adjusted the performance targets from the levels set in
2012 to reflect the Company’s expected 2013 financial
performance. See pages 44-47 for more details regarding
these targets.
In evaluating the 2013 results and compensation decisions,
the Compensation Committee considered that the
Company’s named executive officers substantially met key
objectives in support of the 2013 strategies and that the
2013 strategic investments produced the following positive
results:
• Consumer-to-consumer transaction growth increased
to 5%, compared to 2% growth in 2012, with growth
accelerating in the second half of the year;
• Continued investments also helped deliver 25% revenue
growth in electronic channels;
• Execution of key strategies contributed to a 7% increase in
business-to-business revenue; and
• The Company generated $1.1 billion of cash flow from
operating activities, with over $670 million returned
to stockholders through dividends and stock repurchases.