Western Union 2013 Annual Report Download - page 67
Download and view the complete annual report
Please find page 67 of the 2013 Western Union annual report below. You can navigate through the pages in the report by either clicking on the pages listed below, or by using the keyword search tool below to find specific information within the annual report.-
 1
1 -
2
-
3
-
4
-
5
-
6
-
7
-
8
-
9
-
10
-
11
-
12
-
13
-
14
-
15
-
16
-
17
-
18
-
19
-
20
-
21
-
22
-
23
-
24
-
25
-
26
-
27
-
28
-
29
-
30
-
31
-
32
-
33
-
34
-
35
-
36
-
37
-
38
-
39
-
40
-
41
-
42
-
43
-
44
-
45
-
46
-
47
-
48
-
49
-
50
-
51
-
52
-
53
-
54
-
55
-
56
-
 57
57 -
 58
58 -
 59
59 -
 60
60 -
 61
61 -
 62
62 -
 63
63 -
 64
64 -
 65
65 -
 66
66 -
 67
67 -
 68
68 -
 69
69 -
 70
70 -
 71
71 -
 72
72 -
 73
73 -
 74
74 -
 75
75 -
 76
76 -
 77
77 -
78
-
79
-
80
-
81
-
82
-
83
-
84
-
85
-
86
-
87
-
88
-
89
-
90
-
91
-
92
-
93
-
94
-
95
-
96
-
97
-
98
-
99
-
100
-
101
-
102
-
103
-
104
-
105
-
106
-
107
-
108
-
109
-
110
-
111
-
112
-
113
-
114
-
115
-
116
-
117
-
118
-
119
-
120
-
121
-
122
-
123
-
124
-
125
-
126
-
127
-
128
-
129
-
130
-
131
-
132
-
133
-
134
-
135
-
136
-
137
-
138
-
139
-
140
-
141
-
142
-
143
-
144
-
145
-
146
-
147
-
148
-
149
-
150
-
151
-
152
-
153
-
154
-
155
-
156
-
157
-
158
-
159
-
160
-
161
-
162
-
163
-
164
-
165
-
166
-
167
-
168
-
169
-
170
-
171
-
172
-
173
-
174
-
175
-
176
-
177
-
178
-
179
-
180
-
181
-
182
-
183
-
184
-
185
-
186
-
187
-
188
-
189
-
190
-
191
-
192
-
193
-
194
-
195
-
196
-
197
-
198
-
199
-
200
-
201
-
202
-
203
-
204
-
205
-
206
-
207
-
208
-
209
-
210
-
211
-
212
-
213
-
214
-
215
-
216
-
217
-
218
-
219
-
220
-
221
-
222
-
223
-
224
-
225
-
226
-
227
-
228
-
229
-
230
-
231
-
232
-
233
-
234
-
235
-
236
-
237
-
238
-
239
-
240
-
241
-
242
-
243
-
244
-
245
-
246
-
247
-
248
-
249
-
250
-
251
-
252
-
253
-
254
-
255
-
256
-
257
-
258
-
259
-
260
-
261
-
262
-
263
-
264
-
265
-
266
-
267
-
268
-
269
-
270
-
271
-
272
-
273
-
274
 |
 |

49 | The Western Union Company – Proxy Statement
NOTICE OF 2014 ANNUAL MEETING OF STOCKHOLDERS AND PROXY STATEMENT
Compensation Discussion and Analysis PROXY STATEMENT
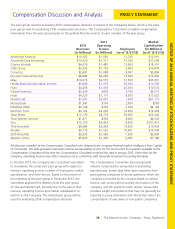
revenue and operating income over the course of the
year should be excluded from the award calculation, as
it believed compensation should not be based on factors
outside of the control of our executives.
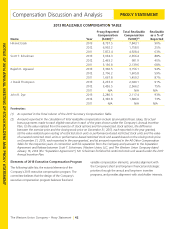
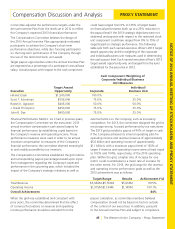
The following table sets forth each named executive officer’s
threshold, target and maximum award opportunities with
respect to the 2013 performance-based restricted stock units:
2013 Performance-Based Restricted Stock Unit Award Opportunity
Executive Threshold Target Maximum
Hikmet Ersek 71,429 271,429 571,430
Scott T. Scheirman(1) 20,938 79,563 167,500
Rajesh K. Agrawal 15,554 59,104 124,430
J. David Thompson 14,357 54,558 114,858
John R. Dye 11,965 45,465 95,716
(1) In connection with his separation from the Company and pursuant to the Separation Agreement, Mr. Scheirman will
receive a prorated payout of the 2013 performance-based restricted stock units based on actual performance.
2012 Performance-Based Restricted Stock Unit Awards.
The vesting of the performance-based restricted stock
unit awards granted in 2012 depended upon the
accomplishment of financial and strategic performance
objectives over a two-year period. Under the original terms
of the award agreements, these awards were also subject to
payout modifiers based on TSR and stock price performance
over the 2012-2014 period if the payout level for the
2012-2013 performance goals was equal to or greater than
150% of target. Based on performance relative to the
performance objectives described below, the committee
certified a payout of 17% of target for each of the named
executive officers other than Mr. Ersek. For Mr. Ersek, the
committee exercised negative discretion to certify a payout
of 13% of target. Accordingly, the TSR and stock price
payout modifiers will not be applied, and these awards
remain subject only to time-based vesting requirements
until February 23, 2015. The 2012-2013 financial and
strategic performance objectives, their respective weightings
and the performance level achievement as of the end of the
2012-2013 performance period, are as follows:
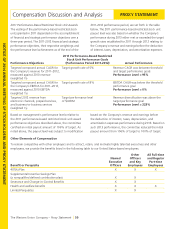
Performance Objectives
2012 Performance-Based Restricted
Stock Unit Performance Goals
(Performance Period 2012-2013) Actual Performance
Targeted compound annual constant
currency growth rate (“CAGR”) for
the Company’s revenue for 2012-
2013, measured against 2011 revenue
(weighted 34%)
Target growth rate of 9% Revenue CAGR was below the threshold
performance goal
Performance Level = 0%
Targeted compound annual CAGR
for the Company’s earnings before
the deduction of interest, taxes,
depreciation, and amortization expenses
(“EBITDA”) for 2012-2013, measured
against 2011 EBITDA (weighted 33%)
Target growth rate of 6% EBITDA CAGR was below the threshold
performance goal
Performance Level = 0%
Targeted compound annual growth
rate for registered customers for
2012-2013, measured against
2011 registered customer levels
(weighted 33%)
Consumer target growth rate of 29%
(weighted 80%)
Business target growth rate of 15%
(weighted 20%)
Registered consumer growth was
between threshold and target
performance goals
Performance Level = 64%
Registered business growth was below
the threshold performance goal
Performance Level = 0%