Western Union 2013 Annual Report Download - page 225
Download and view the complete annual report
Please find page 225 of the 2013 Western Union annual report below. You can navigate through the pages in the report by either clicking on the pages listed below, or by using the keyword search tool below to find specific information within the annual report.-
 1
1 -
2
-
3
-
4
-
5
-
6
-
7
-
8
-
9
-
10
-
11
-
12
-
13
-
14
-
15
-
16
-
17
-
18
-
19
-
20
-
21
-
22
-
23
-
24
-
25
-
26
-
27
-
28
-
29
-
30
-
31
-
32
-
33
-
34
-
35
-
36
-
37
-
38
-
39
-
40
-
41
-
42
-
43
-
44
-
45
-
46
-
47
-
48
-
49
-
50
-
51
-
52
-
53
-
54
-
55
-
56
-
57
-
58
-
59
-
60
-
61
-
62
-
63
-
64
-
65
-
66
-
67
-
68
-
69
-
70
-
71
-
72
-
73
-
74
-
75
-
76
-
77
-
78
-
79
-
80
-
81
-
82
-
83
-
84
-
85
-
86
-
87
-
88
-
89
-
90
-
91
-
92
-
93
-
94
-
95
-
96
-
97
-
98
-
99
-
100
-
101
-
102
-
103
-
104
-
105
-
106
-
107
-
108
-
109
-
110
-
111
-
112
-
113
-
114
-
115
-
116
-
117
-
118
-
119
-
120
-
121
-
122
-
123
-
124
-
125
-
126
-
127
-
128
-
129
-
130
-
131
-
132
-
133
-
134
-
135
-
136
-
137
-
138
-
139
-
140
-
141
-
142
-
143
-
144
-
145
-
146
-
147
-
148
-
149
-
150
-
151
-
152
-
153
-
154
-
155
-
156
-
157
-
158
-
159
-
160
-
161
-
162
-
163
-
164
-
165
-
166
-
167
-
168
-
169
-
170
-
171
-
172
-
173
-
174
-
175
-
176
-
177
-
178
-
179
-
180
-
181
-
182
-
183
-
184
-
185
-
186
-
187
-
188
-
189
-
190
-
191
-
192
-
193
-
194
-
195
-
196
-
197
-
198
-
199
-
200
-
201
-
202
-
203
-
204
-
205
-
206
-
207
-
208
-
209
-
210
-
211
-
212
-
213
-
214
-
 215
215 -
 216
216 -
 217
217 -
 218
218 -
 219
219 -
 220
220 -
 221
221 -
 222
222 -
 223
223 -
 224
224 -
 225
225 -
 226
226 -
 227
227 -
 228
228 -
 229
229 -
 230
230 -
 231
231 -
 232
232 -
 233
233 -
 234
234 -
 235
235 -
236
-
237
-
238
-
239
-
240
-
241
-
242
-
243
-
244
-
245
-
246
-
247
-
248
-
249
-
250
-
251
-
252
-
253
-
254
-
255
-
256
-
257
-
258
-
259
-
260
-
261
-
262
-
263
-
264
-
265
-
266
-
267
-
268
-
269
-
270
-
271
-
272
-
273
-
274
 |
 |

2013 FORM 10-K
THE WESTERN UNION COMPANY
NOTES TO CONSOLIDATED FINANCIAL STATEMENTS (Continued)
115
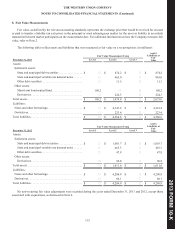
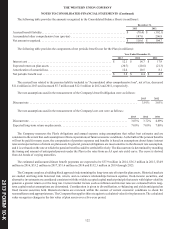
8. Fair Value Measurements
Fair value, as defined by the relevant accounting standards, represents the exchange price that would be received for an asset
or paid to transfer a liability (an exit price) in the principal or most advantageous market for the asset or liability in an orderly
transaction between market participants on the measurement date. For additional information on how the Company measures fair
value, refer to Note 2.
The following tables reflect assets and liabilities that were measured at fair value on a recurring basis (in millions):
Fair Value Measurement Using
Assets/
Liabilities at
Fair
Value
December 31, 2013 Level 1 Level 2 Level 3
Assets:
Settlement assets:
State and municipal debt securities . . . . . . . . . . . . . . . . $ — $ 874.2 $ — $ 874.2
State and municipal variable rate demand notes . . . . . . — 865.0 — 865.0
Other debt securities . . . . . . . . . . . . . . . . . . . . . . . . . . . — 11.3 — 11.3
Other assets:
Short-term bond mutual fund. . . . . . . . . . . . . . . . . . . . . 100.2 — — 100.2
Derivatives . . . . . . . . . . . . . . . . . . . . . . . . . . . . . . . . . . . — 224.3 — 224.3
Total assets. . . . . . . . . . . . . . . . . . . . . . . . . . . . . . . . . . . . . . $ 100.2 $ 1,974.8 $ — $ 2,075.0
Liabilities:
Notes and other borrowings. . . . . . . . . . . . . . . . . . . . . . . . $ — $ 4,343.2 $ — $ 4,343.2
Derivatives. . . . . . . . . . . . . . . . . . . . . . . . . . . . . . . . . . . . . — 223.4 — 223.4
Total liabilities . . . . . . . . . . . . . . . . . . . . . . . . . . . . . . . . . . . $ — $ 4,566.6 $ — $ 4,566.6
Fair Value Measurement Using
Assets/
Liabilities at
Fair
Value
December 31, 2012 Level 1 Level 2 Level 3
Assets:
Settlement assets:
State and municipal debt securities . . . . . . . . . . . . . . . . $ — $ 1,003.7 $ — $ 1,003.7
State and municipal variable rate demand notes . . . . . . — 463.3 — 463.3
Other debt securities . . . . . . . . . . . . . . . . . . . . . . . . . . . — 47.8 — 47.8
Other assets:
Derivatives . . . . . . . . . . . . . . . . . . . . . . . . . . . . . . . . . . . — 96.8 — 96.8
Total assets. . . . . . . . . . . . . . . . . . . . . . . . . . . . . . . . . . . . . . $ — $ 1,611.6 $ — $ 1,611.6
Liabilities:
Notes and other borrowings. . . . . . . . . . . . . . . . . . . . . . . . $ — $ 4,200.8 $ — $ 4,200.8
Derivatives. . . . . . . . . . . . . . . . . . . . . . . . . . . . . . . . . . . . . — 86.1 — 86.1
Total liabilities . . . . . . . . . . . . . . . . . . . . . . . . . . . . . . . . . . . $ — $ 4,286.9 $ — $ 4,286.9
No non-recurring fair value adjustments were recorded during the years ended December 31, 2013 and 2012, except those
associated with acquisitions, as disclosed in Note 4.