Western Union 2013 Annual Report Download - page 216
Download and view the complete annual report
Please find page 216 of the 2013 Western Union annual report below. You can navigate through the pages in the report by either clicking on the pages listed below, or by using the keyword search tool below to find specific information within the annual report.-
 1
1 -
2
-
3
-
4
-
5
-
6
-
7
-
8
-
9
-
10
-
11
-
12
-
13
-
14
-
15
-
16
-
17
-
18
-
19
-
20
-
21
-
22
-
23
-
24
-
25
-
26
-
27
-
28
-
29
-
30
-
31
-
32
-
33
-
34
-
35
-
36
-
37
-
38
-
39
-
40
-
41
-
42
-
43
-
44
-
45
-
46
-
47
-
48
-
49
-
50
-
51
-
52
-
53
-
54
-
55
-
56
-
57
-
58
-
59
-
60
-
61
-
62
-
63
-
64
-
65
-
66
-
67
-
68
-
69
-
70
-
71
-
72
-
73
-
74
-
75
-
76
-
77
-
78
-
79
-
80
-
81
-
82
-
83
-
84
-
85
-
86
-
87
-
88
-
89
-
90
-
91
-
92
-
93
-
94
-
95
-
96
-
97
-
98
-
99
-
100
-
101
-
102
-
103
-
104
-
105
-
106
-
107
-
108
-
109
-
110
-
111
-
112
-
113
-
114
-
115
-
116
-
117
-
118
-
119
-
120
-
121
-
122
-
123
-
124
-
125
-
126
-
127
-
128
-
129
-
130
-
131
-
132
-
133
-
134
-
135
-
136
-
137
-
138
-
139
-
140
-
141
-
142
-
143
-
144
-
145
-
146
-
147
-
148
-
149
-
150
-
151
-
152
-
153
-
154
-
155
-
156
-
157
-
158
-
159
-
160
-
161
-
162
-
163
-
164
-
165
-
166
-
167
-
168
-
169
-
170
-
171
-
172
-
173
-
174
-
175
-
176
-
177
-
178
-
179
-
180
-
181
-
182
-
183
-
184
-
185
-
186
-
187
-
188
-
189
-
190
-
191
-
192
-
193
-
194
-
195
-
196
-
197
-
198
-
199
-
200
-
201
-
202
-
203
-
204
-
205
-
 206
206 -
 207
207 -
 208
208 -
 209
209 -
 210
210 -
 211
211 -
 212
212 -
 213
213 -
 214
214 -
 215
215 -
 216
216 -
 217
217 -
 218
218 -
 219
219 -
 220
220 -
 221
221 -
 222
222 -
 223
223 -
 224
224 -
 225
225 -
 226
226 -
227
-
228
-
229
-
230
-
231
-
232
-
233
-
234
-
235
-
236
-
237
-
238
-
239
-
240
-
241
-
242
-
243
-
244
-
245
-
246
-
247
-
248
-
249
-
250
-
251
-
252
-
253
-
254
-
255
-
256
-
257
-
258
-
259
-
260
-
261
-
262
-
263
-
264
-
265
-
266
-
267
-
268
-
269
-
270
-
271
-
272
-
273
-
274
 |
 |

2013 FORM 10-K
THE WESTERN UNION COMPANY
NOTES TO CONSOLIDATED FINANCIAL STATEMENTS (Continued)
106
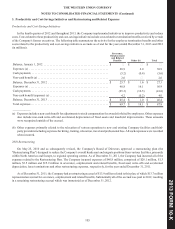
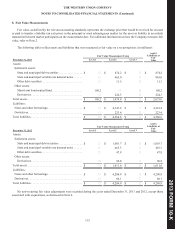
The following table presents expenses related to productivity and cost-savings initiatives and restructuring activities as reflected
in the Consolidated Statements of Income (in millions):
Year Ended December 31,
2013 2012 2011
Productivity and Cost-Savings
Initiatives
Restructuring and
Related Expenses
Cost of services . . . . . . . . . . . . . . . . . . . . . . . . . . . . . . . . . . . . . . . . . . . . $ 24.3 $ 5.5 $ 10.6
Selling, general and administrative . . . . . . . . . . . . . . . . . . . . . . . . . . . . . 32.6 25.4 36.2
Total expenses, pre-tax. . . . . . . . . . . . . . . . . . . . . . . . . . . . . . . . . . . . . . . $ 56.9 $ 30.9 $ 46.8
Total expenses, net of tax. . . . . . . . . . . . . . . . . . . . . . . . . . . . . . . . . . . . . $ 40.2 $ 20.2 $ 32.0
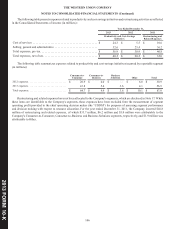
The following table summarizes expenses related to productivity and cost-savings initiatives incurred by reportable segment
(in millions):
Consumer-to-
Consumer
Consumer-to-
Business
Business
Solutions Other Total
2012 expenses. . . . . . . . . . . . . . . . . . . . . . . . . . . . . $ 20.9 $ 4.0 $ — $ 6.0 $ 30.9
2013 expenses. . . . . . . . . . . . . . . . . . . . . . . . . . . . . 43.8 5.4 3.6 4.1 56.9
Total expenses. . . . . . . . . . . . . . . . . . . . . . . . . . . . . $ 64.7 $ 9.4 $ 3.6 $ 10.1 $ 87.8
Restructuring and related expenses have not been allocated to the Company's segments, which are disclosed in Note 17. While
these items are identifiable to the Company's segments, these expenses have been excluded from the measurement of segment
operating profit provided to the chief operating decision maker (the "CODM") for purposes of assessing segment performance
and decision making with respect to resource allocation. For the year ended December 31, 2011, the Company incurred $46.8
million of restructuring and related expenses, of which $33.7 million, $6.2 million and $5.0 million were attributable to the
Company's Consumer-to-Consumer, Consumer-to-Business and Business Solutions segments, respectively, and $1.9 million was
attributable to Other.