Western Union 2013 Annual Report Download - page 211
Download and view the complete annual report
Please find page 211 of the 2013 Western Union annual report below. You can navigate through the pages in the report by either clicking on the pages listed below, or by using the keyword search tool below to find specific information within the annual report.-
 1
1 -
2
-
3
-
4
-
5
-
6
-
7
-
8
-
9
-
10
-
11
-
12
-
13
-
14
-
15
-
16
-
17
-
18
-
19
-
20
-
21
-
22
-
23
-
24
-
25
-
26
-
27
-
28
-
29
-
30
-
31
-
32
-
33
-
34
-
35
-
36
-
37
-
38
-
39
-
40
-
41
-
42
-
43
-
44
-
45
-
46
-
47
-
48
-
49
-
50
-
51
-
52
-
53
-
54
-
55
-
56
-
57
-
58
-
59
-
60
-
61
-
62
-
63
-
64
-
65
-
66
-
67
-
68
-
69
-
70
-
71
-
72
-
73
-
74
-
75
-
76
-
77
-
78
-
79
-
80
-
81
-
82
-
83
-
84
-
85
-
86
-
87
-
88
-
89
-
90
-
91
-
92
-
93
-
94
-
95
-
96
-
97
-
98
-
99
-
100
-
101
-
102
-
103
-
104
-
105
-
106
-
107
-
108
-
109
-
110
-
111
-
112
-
113
-
114
-
115
-
116
-
117
-
118
-
119
-
120
-
121
-
122
-
123
-
124
-
125
-
126
-
127
-
128
-
129
-
130
-
131
-
132
-
133
-
134
-
135
-
136
-
137
-
138
-
139
-
140
-
141
-
142
-
143
-
144
-
145
-
146
-
147
-
148
-
149
-
150
-
151
-
152
-
153
-
154
-
155
-
156
-
157
-
158
-
159
-
160
-
161
-
162
-
163
-
164
-
165
-
166
-
167
-
168
-
169
-
170
-
171
-
172
-
173
-
174
-
175
-
176
-
177
-
178
-
179
-
180
-
181
-
182
-
183
-
184
-
185
-
186
-
187
-
188
-
189
-
190
-
191
-
192
-
193
-
194
-
195
-
196
-
197
-
198
-
199
-
200
-
 201
201 -
 202
202 -
 203
203 -
 204
204 -
 205
205 -
 206
206 -
 207
207 -
 208
208 -
 209
209 -
 210
210 -
 211
211 -
 212
212 -
 213
213 -
 214
214 -
 215
215 -
 216
216 -
 217
217 -
 218
218 -
 219
219 -
 220
220 -
 221
221 -
222
-
223
-
224
-
225
-
226
-
227
-
228
-
229
-
230
-
231
-
232
-
233
-
234
-
235
-
236
-
237
-
238
-
239
-
240
-
241
-
242
-
243
-
244
-
245
-
246
-
247
-
248
-
249
-
250
-
251
-
252
-
253
-
254
-
255
-
256
-
257
-
258
-
259
-
260
-
261
-
262
-
263
-
264
-
265
-
266
-
267
-
268
-
269
-
270
-
271
-
272
-
273
-
274
 |
 |

2013 FORM 10-K
THE WESTERN UNION COMPANY
NOTES TO CONSOLIDATED FINANCIAL STATEMENTS (Continued)
101
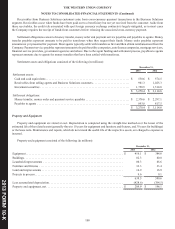
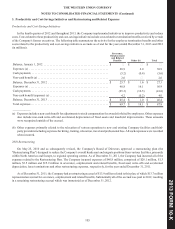
Amounts charged to expense for depreciation of property and equipment were $64.2 million, $61.7 million and $61.0 million
during the years ended December 31, 2013, 2012 and 2011, respectively.
Goodwill
Goodwill represents the excess of purchase price over the fair value of tangible and other intangible assets acquired, less
liabilities assumed arising from business combinations. The Company's annual impairment assessment did not identify any goodwill
impairment during the years ended December 31, 2013, 2012 and 2011.
Other Intangible Assets
Other intangible assets primarily consist of acquired contracts, contract costs (primarily amounts paid to agents in connection
with establishing and renewing long-term contracts) and software. Other intangible assets are amortized on a straight-line basis
over the length of the contract or benefit periods. Included in the Consolidated Statements of Income is amortization expense of
$198.6 million, $184.4 million and $131.6 million for the years ended December 31, 2013, 2012 and 2011, respectively.
Acquired contracts include customer and contractual relationships and networks of subagents that are recognized in connection
with the Company's acquisitions.
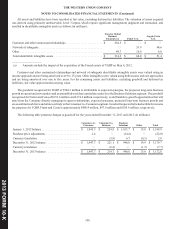
The Company capitalizes initial payments for new and renewed agent contracts to the extent recoverable through future
operations or penalties in the case of early termination. The Company's accounting policy is to limit the amount of capitalized
costs for a given contract to the lesser of the estimated future cash flows from the contract or the termination fees the Company
would receive in the event of early termination of the contract.
The Company purchases and develops software that is used in providing services and in performing administrative functions.
Software development costs are capitalized once technological feasibility of the software has been established. Costs incurred
prior to establishing technological feasibility are expensed as incurred. Technological feasibility is established when the Company
has completed all planning and designing activities that are necessary to determine that a product can be produced to meet its
design specifications, including functions, features and technical performance requirements. Capitalization of costs ceases when
the product is available for general use. Software development costs and purchased software are generally amortized over a term
of three to five years.
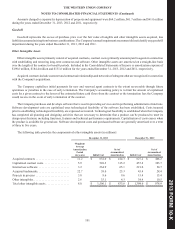
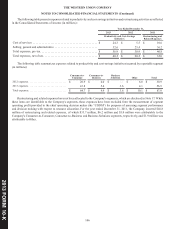
The following table provides the components of other intangible assets (in millions):
December 31, 2013 December 31, 2012
Weighted-
Average
Amortization
Period
(in years) Initial Cost
Net of
Accumulated
Amortization Initial Cost
Net of
Accumulated
Amortization
Acquired contracts . . . . . . . . . . . . . . . . . . . . . . . 11.2 $ 632.0 $ 414.3 $ 627.2 $ 466.2
Capitalized contract costs . . . . . . . . . . . . . . . . . . 5.9 528.5 315.2 457.2 303.7
Internal use software. . . . . . . . . . . . . . . . . . . . . . 3.2 264.9 65.1 221.0 54.7
Acquired trademarks. . . . . . . . . . . . . . . . . . . . . . 22.7 38.0 25.3 43.4 28.4
Projects in process . . . . . . . . . . . . . . . . . . . . . . . 3.0 9.6 9.6 15.4 15.4
Other intangibles . . . . . . . . . . . . . . . . . . . . . . . . . 2.6 33.1 4.3 34.4 10.5
Total other intangible assets . . . . . . . . . . . . . . . . 8.0 $ 1,506.1 $ 833.8 $ 1,398.6 $ 878.9