Western Union 2013 Annual Report Download - page 180
Download and view the complete annual report
Please find page 180 of the 2013 Western Union annual report below. You can navigate through the pages in the report by either clicking on the pages listed below, or by using the keyword search tool below to find specific information within the annual report.-
 1
1 -
2
-
3
-
4
-
5
-
6
-
7
-
8
-
9
-
10
-
11
-
12
-
13
-
14
-
15
-
16
-
17
-
18
-
19
-
20
-
21
-
22
-
23
-
24
-
25
-
26
-
27
-
28
-
29
-
30
-
31
-
32
-
33
-
34
-
35
-
36
-
37
-
38
-
39
-
40
-
41
-
42
-
43
-
44
-
45
-
46
-
47
-
48
-
49
-
50
-
51
-
52
-
53
-
54
-
55
-
56
-
57
-
58
-
59
-
60
-
61
-
62
-
63
-
64
-
65
-
66
-
67
-
68
-
69
-
70
-
71
-
72
-
73
-
74
-
75
-
76
-
77
-
78
-
79
-
80
-
81
-
82
-
83
-
84
-
85
-
86
-
87
-
88
-
89
-
90
-
91
-
92
-
93
-
94
-
95
-
96
-
97
-
98
-
99
-
100
-
101
-
102
-
103
-
104
-
105
-
106
-
107
-
108
-
109
-
110
-
111
-
112
-
113
-
114
-
115
-
116
-
117
-
118
-
119
-
120
-
121
-
122
-
123
-
124
-
125
-
126
-
127
-
128
-
129
-
130
-
131
-
132
-
133
-
134
-
135
-
136
-
137
-
138
-
139
-
140
-
141
-
142
-
143
-
144
-
145
-
146
-
147
-
148
-
149
-
150
-
151
-
152
-
153
-
154
-
155
-
156
-
157
-
158
-
159
-
160
-
161
-
162
-
163
-
164
-
165
-
166
-
167
-
168
-
169
-
 170
170 -
 171
171 -
 172
172 -
 173
173 -
 174
174 -
 175
175 -
 176
176 -
 177
177 -
 178
178 -
 179
179 -
 180
180 -
 181
181 -
 182
182 -
 183
183 -
 184
184 -
 185
185 -
 186
186 -
 187
187 -
 188
188 -
 189
189 -
 190
190 -
191
-
192
-
193
-
194
-
195
-
196
-
197
-
198
-
199
-
200
-
201
-
202
-
203
-
204
-
205
-
206
-
207
-
208
-
209
-
210
-
211
-
212
-
213
-
214
-
215
-
216
-
217
-
218
-
219
-
220
-
221
-
222
-
223
-
224
-
225
-
226
-
227
-
228
-
229
-
230
-
231
-
232
-
233
-
234
-
235
-
236
-
237
-
238
-
239
-
240
-
241
-
242
-
243
-
244
-
245
-
246
-
247
-
248
-
249
-
250
-
251
-
252
-
253
-
254
-
255
-
256
-
257
-
258
-
259
-
260
-
261
-
262
-
263
-
264
-
265
-
266
-
267
-
268
-
269
-
270
-
271
-
272
-
273
-
274
 |
 |

2013 FORM 10-K
70
Operating loss
2013 compared to 2012
For the year ended December 31, 2013, the operating loss decreased compared to the prior year due to increased revenue,
partially offset by increased strategic investments. Additionally, operating loss for the year ended December 31, 2013 was impacted
by decreased integration expenses. The changes in operating loss margins in the segment are due to these same factors.
2012 compared to 2011
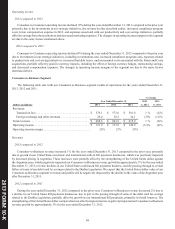
For the year ended December 31, 2012, Business Solutions operating loss increased compared to the prior year primarily due
to increased expenses resulting from the acquisition of TGBP, including incremental depreciation and amortization expenses and
integration expenses.
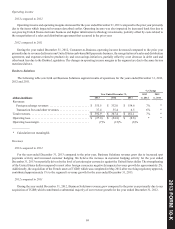
Other
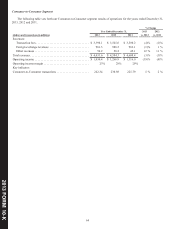
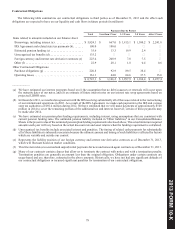
The following table sets forth Other results for the years ended December 31, 2013, 2012 and 2011.
% Change
Year Ended December 31, 2013 2012
(dollars in millions) 2013 2012 2011 vs. 2012 vs. 2011
Revenues . . . . . . . . . . . . . . . . . . . . . . . . . . . . . . . . . . . . . . . . . . . . $ 107.0 $ 109.2 $ 106.0 (2)% 3%
Operating loss . . . . . . . . . . . . . . . . . . . . . . . . . . . . . . . . . . . . . . . . $ (17.9) $ (19.7) $ (21.5) * *
____________
* Calculation not meaningful.
Revenues
2013 compared to 2012
Other revenue decreased for the year ended December 31, 2013 compared to the prior year primarily due to declines in our
prepaid business.
2012 compared to 2011
Other revenue increased for the year ended December 31, 2012 compared to the prior year primarily due to increases in our
prepaid business, partially offset by a decrease in investment income in our money order business.
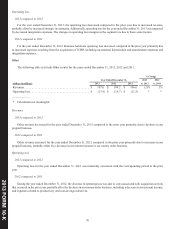
Operating loss
2013 compared to 2012
Operating loss for the year ended December 31, 2013 was materially consistent with the corresponding period in the prior
year.
2012 compared to 2011
During the year ended December 31, 2012, the decrease in operating loss was due to costs associated with acquisition activity
that occurred in the prior year, partially offset by declines in our money order business, including a decrease in investment income,
and expenses related to productivity and cost-savings initiatives.