Western Union 2011 Annual Report Download - page 96
Download and view the complete annual report
Please find page 96 of the 2011 Western Union annual report below. You can navigate through the pages in the report by either clicking on the pages listed below, or by using the keyword search tool below to find specific information within the annual report.-
 1
1 -
2
-
3
-
4
-
5
-
6
-
7
-
8
-
9
-
10
-
11
-
12
-
13
-
14
-
15
-
16
-
17
-
18
-
19
-
20
-
21
-
22
-
23
-
24
-
25
-
26
-
27
-
28
-
29
-
30
-
31
-
32
-
33
-
34
-
35
-
36
-
37
-
38
-
39
-
40
-
41
-
42
-
43
-
44
-
45
-
46
-
47
-
48
-
49
-
50
-
51
-
52
-
53
-
54
-
55
-
56
-
57
-
58
-
59
-
60
-
61
-
62
-
63
-
64
-
65
-
66
-
67
-
68
-
69
-
70
-
71
-
72
-
73
-
74
-
75
-
76
-
77
-
78
-
79
-
80
-
81
-
82
-
83
-
84
-
85
-
 86
86 -
 87
87 -
 88
88 -
 89
89 -
 90
90 -
 91
91 -
 92
92 -
 93
93 -
 94
94 -
 95
95 -
 96
96 -
 97
97 -
 98
98 -
 99
99 -
 100
100 -
 101
101 -
 102
102 -
 103
103 -
 104
104 -
 105
105 -
 106
106 -
107
-
108
-
109
-
110
-
111
-
112
-
113
-
114
-
115
-
116
-
117
-
118
-
119
-
120
-
121
-
122
-
123
-
124
-
125
-
126
-
127
-
128
-
129
-
130
-
131
-
132
-
133
-
134
-
135
-
136
-
137
-
138
-
139
-
140
-
141
-
142
-
143
-
144
-
145
-
146
-
147
-
148
-
149
-
150
-
151
-
152
-
153
-
154
-
155
-
156
-
157
-
158
-
159
-
160
-
161
-
162
-
163
-
164
-
165
-
166
-
167
-
168
-
169
 |
 |

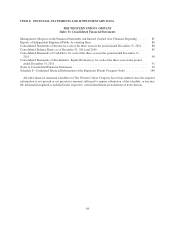
THE WESTERN UNION COMPANY
Consolidated Balance Sheets
(in millions, except per share amounts)
December 31,
2011 2010
Assets
Cash and cash equivalents .................................................. $ 1,370.9 $ 2,157.4
Settlement assets ......................................................... 3,091.2 2,635.2
Property and equipment, net of accumulated depreciation of $429.7 and $383.6,
respectively ........................................................... 198.1 196.5
Goodwill ............................................................... 3,198.9 2,151.7
Other intangible assets, net of accumulated amortization of $462.5 and $441.2,
respectively ........................................................... 847.4 438.0
Other assets ............................................................. 363.4 350.4
Total assets ............................................................. $ 9,069.9 $ 7,929.2
Liabilities and Stockholders’ Equity
Liabilities:
Accounts payable and accrued liabilities .................................... $ 535.0 $ 520.4
Settlement obligations ................................................... 3,091.2 2,635.2
Income taxes payable ................................................... 302.4 356.6
Deferred tax liability, net ................................................ 389.7 289.9
Borrowings ........................................................... 3,583.2 3,289.9
Other liabilities ........................................................ 273.6 254.5
Total liabilities .......................................................... 8,175.1 7,346.5
Commitments and contingencies (Note 6)
Stockholders’ equity:
Preferred stock, $1.00 par value; 10 shares authorized; no shares issued .......... — —
Common stock, $0.01 par value; 2,000 shares authorized; 619.4 shares and 654.0
shares issued and outstanding as of December 31, 2011 and 2010,
respectively ....................................................... 6.2 6.5
Capital surplus ....................................................... 247.1 117.4
Retained earnings .................................................... 760.0 591.6
Accumulated other comprehensive loss ................................... (118.5) (132.8)
Total stockholders’ equity .................................................. 894.8 582.7
Total liabilities and stockholders’ equity ...................................... $ 9,069.9 $ 7,929.2
See Notes to Consolidated Financial Statements.
89