Western Union 2011 Annual Report Download - page 101
Download and view the complete annual report
Please find page 101 of the 2011 Western Union annual report below. You can navigate through the pages in the report by either clicking on the pages listed below, or by using the keyword search tool below to find specific information within the annual report.-
 1
1 -
2
-
3
-
4
-
5
-
6
-
7
-
8
-
9
-
10
-
11
-
12
-
13
-
14
-
15
-
16
-
17
-
18
-
19
-
20
-
21
-
22
-
23
-
24
-
25
-
26
-
27
-
28
-
29
-
30
-
31
-
32
-
33
-
34
-
35
-
36
-
37
-
38
-
39
-
40
-
41
-
42
-
43
-
44
-
45
-
46
-
47
-
48
-
49
-
50
-
51
-
52
-
53
-
54
-
55
-
56
-
57
-
58
-
59
-
60
-
61
-
62
-
63
-
64
-
65
-
66
-
67
-
68
-
69
-
70
-
71
-
72
-
73
-
74
-
75
-
76
-
77
-
78
-
79
-
80
-
81
-
82
-
83
-
84
-
85
-
86
-
87
-
88
-
89
-
90
-
 91
91 -
 92
92 -
 93
93 -
 94
94 -
 95
95 -
 96
96 -
 97
97 -
 98
98 -
 99
99 -
 100
100 -
 101
101 -
 102
102 -
 103
103 -
 104
104 -
 105
105 -
 106
106 -
 107
107 -
 108
108 -
 109
109 -
 110
110 -
 111
111 -
112
-
113
-
114
-
115
-
116
-
117
-
118
-
119
-
120
-
121
-
122
-
123
-
124
-
125
-
126
-
127
-
128
-
129
-
130
-
131
-
132
-
133
-
134
-
135
-
136
-
137
-
138
-
139
-
140
-
141
-
142
-
143
-
144
-
145
-
146
-
147
-
148
-
149
-
150
-
151
-
152
-
153
-
154
-
155
-
156
-
157
-
158
-
159
-
160
-
161
-
162
-
163
-
164
-
165
-
166
-
167
-
168
-
169
 |
 |

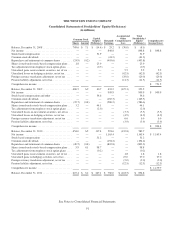
THE WESTERN UNION COMPANY
NOTES TO CONSOLIDATED FINANCIAL STATEMENTS—(Continued)
The following table provides the calculation of diluted weighted-average shares outstanding (in millions):
For the Year Ended December 31,
2011 2010 2009
Basic weighted-average shares outstanding ............................ 630.6 666.5 698.9
Common stock equivalents ......................................... 3.6 2.4 2.1
Diluted weighted-average shares outstanding ........................... 634.2 668.9 701.0
Fair Value Measurements
The Company determines the fair values of its assets and liabilities that are recognized or disclosed at fair
value in accordance with the hierarchy described below. The fair values of the assets and liabilities held in the
Company’s defined benefit plan trust (“Trust”) are recognized or disclosed utilizing the same hierarchy. The
following three levels of inputs may be used to measure fair value:
•Level 1: Quoted prices in active markets for identical assets or liabilities.
•Level 2: Observable inputs other than Level 1 prices such as quoted prices for similar assets or liabilities,
quoted prices in markets that are not active, or other inputs that are observable or can be corroborated by
observable market data for substantially the full term of the assets or liabilities. For most of these assets,
the Company utilizes pricing services that use multiple prices as inputs to determine daily market values.
In addition, the Trust has other investments that fall within Level 2 that are valued at net asset value which
is not quoted on an active market; however, the unit price is based on underlying investments which are
traded on an active market.
•Level 3: Unobservable inputs that are supported by little or no market activity and that are significant to
the fair value of the assets or liabilities. Level 3 assets and liabilities include items where the
determination of fair value requires significant management judgment or estimation. The Company has
Level 3 assets that are recognized and disclosed at fair value on a non-recurring basis related to the
Company’s business combinations, where the values of the intangible assets and goodwill acquired in a
purchase are derived utilizing one of the three recognized approaches: the market approach, the income
approach or the cost approach.
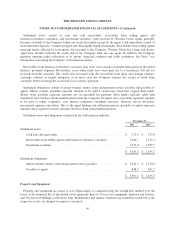
Carrying amounts for many of the Company’s financial instruments, including cash and cash equivalents,
settlement cash and cash equivalents, settlement receivables, settlement obligations, borrowings under the
commercial paper program and other short-term notes payable, approximate fair value due to their short
maturities. Investment securities, included in settlement assets, and derivative financial instruments are carried at
fair value and included in Note 8. Fixed rate notes are carried at their original issuance values as adjusted over
time to accrete that value to par, except for portions of notes hedged by interest rate swap agreements as
disclosed in Note 14. The fair values of fixed rate notes are also disclosed in Note 15 and are based on market
quotations. For more information on the fair value of financial instruments, see Note 8.
The fair values of non-financial assets and liabilities related to the Company’s business combinations are
disclosed in Note 3. The fair values of financial assets and liabilities related to the Trust are disclosed in Note 11.
94