Western Union 2011 Annual Report Download - page 118
Download and view the complete annual report
Please find page 118 of the 2011 Western Union annual report below. You can navigate through the pages in the report by either clicking on the pages listed below, or by using the keyword search tool below to find specific information within the annual report.-
 1
1 -
2
-
3
-
4
-
5
-
6
-
7
-
8
-
9
-
10
-
11
-
12
-
13
-
14
-
15
-
16
-
17
-
18
-
19
-
20
-
21
-
22
-
23
-
24
-
25
-
26
-
27
-
28
-
29
-
30
-
31
-
32
-
33
-
34
-
35
-
36
-
37
-
38
-
39
-
40
-
41
-
42
-
43
-
44
-
45
-
46
-
47
-
48
-
49
-
50
-
51
-
52
-
53
-
54
-
55
-
56
-
57
-
58
-
59
-
60
-
61
-
62
-
63
-
64
-
65
-
66
-
67
-
68
-
69
-
70
-
71
-
72
-
73
-
74
-
75
-
76
-
77
-
78
-
79
-
80
-
81
-
82
-
83
-
84
-
85
-
86
-
87
-
88
-
89
-
90
-
91
-
92
-
93
-
94
-
95
-
96
-
97
-
98
-
99
-
100
-
101
-
102
-
103
-
104
-
105
-
106
-
107
-
 108
108 -
 109
109 -
 110
110 -
 111
111 -
 112
112 -
 113
113 -
 114
114 -
 115
115 -
 116
116 -
 117
117 -
 118
118 -
 119
119 -
 120
120 -
 121
121 -
 122
122 -
 123
123 -
 124
124 -
 125
125 -
 126
126 -
 127
127 -
 128
128 -
129
-
130
-
131
-
132
-
133
-
134
-
135
-
136
-
137
-
138
-
139
-
140
-
141
-
142
-
143
-
144
-
145
-
146
-
147
-
148
-
149
-
150
-
151
-
152
-
153
-
154
-
155
-
156
-
157
-
158
-
159
-
160
-
161
-
162
-
163
-
164
-
165
-
166
-
167
-
168
-
169
 |
 |

THE WESTERN UNION COMPANY
NOTES TO CONSOLIDATED FINANCIAL STATEMENTS—(Continued)
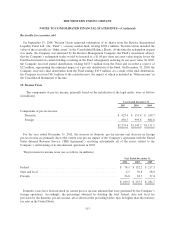
$6.0 million and $293.1 million are included in the “Due within 1 year,” “Due after 1 year through 5 years,”
“Due after 5 years through 10 years” and “Due after 10 years” categories, respectively, in the table above.
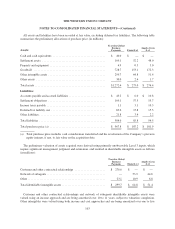
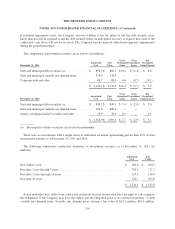
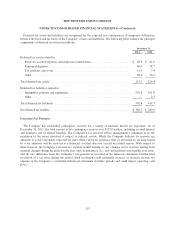
8. Fair Value Measurements
Fair value, as defined by the relevant accounting standards, represents the exchange price that would be
received for an asset or paid to transfer a liability (an exit price) in the principal or most advantageous market for
the asset or liability in an orderly transaction between market participants on the measurement date. For
additional information on how the Company measures fair value, refer to Note 2.
The following table reflects assets and liabilities that were measured and carried at fair value on a recurring
basis (in millions):
Fair Value Measurement Using Assets/Liabilities
at Fair Value
December 31, 2011 Level 1 Level 2 Level 3
Assets:
State and municipal debt securities ..... $ — $ 866.5 $ — $ 866.5
State and municipal variable rate
demand notes .................... — 376.9 — 376.9
Corporate debt and other ............. 0.1 88.5 — 88.6
Derivatives ....................... — 124.8 — 124.8
Total assets .......................... $ 0.1 $ 1,456.7 $ — $ 1,456.8
Liabilities:
Derivatives ....................... $ — $ 86.6 $ — $ 86.6
Total liabilities ....................... $ — $ 86.6 $ — $ 86.6
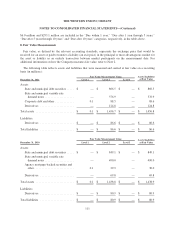
Fair Value Measurement Using Assets/Liabilities
at Fair ValueDecember 31, 2010 Level 1 Level 2 Level 3
Assets:
State and municipal debt securities ..... $ — $ 849.1 $ — $ 849.1
State and municipal variable rate
demand notes .................... — 490.0 — 490.0
Agency mortgage-backed securities and
other ........................... 0.1 29.9 — 30.0
Derivatives ....................... — 69.8 — 69.8
Total assets .......................... $ 0.1 $ 1,438.8 $ — $ 1,438.9
Liabilities:
Derivatives ....................... $ — $ 80.9 $ — $ 80.9
Total liabilities ....................... $ — $ 80.9 $ — $ 80.9
111