Western Union 2011 Annual Report Download - page 130
Download and view the complete annual report
Please find page 130 of the 2011 Western Union annual report below. You can navigate through the pages in the report by either clicking on the pages listed below, or by using the keyword search tool below to find specific information within the annual report.-
 1
1 -
2
-
3
-
4
-
5
-
6
-
7
-
8
-
9
-
10
-
11
-
12
-
13
-
14
-
15
-
16
-
17
-
18
-
19
-
20
-
21
-
22
-
23
-
24
-
25
-
26
-
27
-
28
-
29
-
30
-
31
-
32
-
33
-
34
-
35
-
36
-
37
-
38
-
39
-
40
-
41
-
42
-
43
-
44
-
45
-
46
-
47
-
48
-
49
-
50
-
51
-
52
-
53
-
54
-
55
-
56
-
57
-
58
-
59
-
60
-
61
-
62
-
63
-
64
-
65
-
66
-
67
-
68
-
69
-
70
-
71
-
72
-
73
-
74
-
75
-
76
-
77
-
78
-
79
-
80
-
81
-
82
-
83
-
84
-
85
-
86
-
87
-
88
-
89
-
90
-
91
-
92
-
93
-
94
-
95
-
96
-
97
-
98
-
99
-
100
-
101
-
102
-
103
-
104
-
105
-
106
-
107
-
108
-
109
-
110
-
111
-
112
-
113
-
114
-
115
-
116
-
117
-
118
-
119
-
 120
120 -
 121
121 -
 122
122 -
 123
123 -
 124
124 -
 125
125 -
 126
126 -
 127
127 -
 128
128 -
 129
129 -
 130
130 -
 131
131 -
 132
132 -
 133
133 -
 134
134 -
 135
135 -
 136
136 -
 137
137 -
 138
138 -
 139
139 -
 140
140 -
141
-
142
-
143
-
144
-
145
-
146
-
147
-
148
-
149
-
150
-
151
-
152
-
153
-
154
-
155
-
156
-
157
-
158
-
159
-
160
-
161
-
162
-
163
-
164
-
165
-
166
-
167
-
168
-
169
 |
 |

THE WESTERN UNION COMPANY
NOTES TO CONSOLIDATED FINANCIAL STATEMENTS—(Continued)
and therefore are valued using the NAV per share provided by the investment sponsor or third party
administrator. Funds investing in diverse hedge fund strategies (primarily commingled funds) with the
following composition of underlying hedge fund investments within the pension plans at
December 31, 2011: commodities/currencies (34%), equity long/short (20%), relative value (17%), multi-
strategy (11%), event driven (10%), and global-macro (8%). There are no redemption restrictions, and
redemptions can generally be done monthly or quarterly with required notice ranging from one to 45 days.
(c) Diversified investments in royalty rights related to the sale of pharmaceutical and biotechnology products by
third parties. Also included are private equity funds with a focus on venture capital and mezzanine financing
strategies.
The maturities of debt securities as of December 31, 2011 range from less than one year to approximately
38 years with a weighted-average maturity of 15 years.
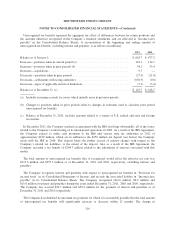
The following tables provide summaries of changes in the fair value of the Trust’s Level 3 financial assets (in
millions):
Royalty
Rights
Private
Equity Total
Balance, January 1, 2010 ............................................... $ — $ 2.0 $ 2.0
Actual return on plan assets:
Relating to assets still held as of the reporting date ...................... — (0.4) (0.4)
Relating to assets sold during the period ............................... — 0.2 0.2
Net purchases and sales ................................................ — (0.5) (0.5)
Balance, December 31, 2010 ............................................ $ — $ 1.3 $ 1.3
Actual return on plan assets:
Relating to assets still held as of the reporting date ...................... — (0.8) (0.8)
Relating to assets sold during the period ............................... — 0.9 0.9
Net purchases and sales ................................................ 11.4 0.8 12.2
Balance, December 31, 2011 ............................................ $ 11.4 $ 2.2 $ 13.6
The estimated undiscounted future benefit payments are expected to be $40.4 million in 2012, $39.0 million in
2013, $37.5 million in 2014, $36.0 million in 2015, $34.5 million in 2016 and $147.2 million in 2017 through
2021.
12. Operating Lease Commitments
The Company leases certain real properties for use as customer service centers and administrative and sales
offices. The Company also leases data communications terminals, computers and office equipment. Certain of
these leases contain renewal options and escalation provisions. Total rent expense under operating leases, net of
sublease income, was $44.2 million, $34.7 million and $34.0 million during the years ended December 31, 2011,
2010 and 2009, respectively.
123