Western Union 2011 Annual Report Download - page 104
Download and view the complete annual report
Please find page 104 of the 2011 Western Union annual report below. You can navigate through the pages in the report by either clicking on the pages listed below, or by using the keyword search tool below to find specific information within the annual report.-
 1
1 -
2
-
3
-
4
-
5
-
6
-
7
-
8
-
9
-
10
-
11
-
12
-
13
-
14
-
15
-
16
-
17
-
18
-
19
-
20
-
21
-
22
-
23
-
24
-
25
-
26
-
27
-
28
-
29
-
30
-
31
-
32
-
33
-
34
-
35
-
36
-
37
-
38
-
39
-
40
-
41
-
42
-
43
-
44
-
45
-
46
-
47
-
48
-
49
-
50
-
51
-
52
-
53
-
54
-
55
-
56
-
57
-
58
-
59
-
60
-
61
-
62
-
63
-
64
-
65
-
66
-
67
-
68
-
69
-
70
-
71
-
72
-
73
-
74
-
75
-
76
-
77
-
78
-
79
-
80
-
81
-
82
-
83
-
84
-
85
-
86
-
87
-
88
-
89
-
90
-
91
-
92
-
93
-
 94
94 -
 95
95 -
 96
96 -
 97
97 -
 98
98 -
 99
99 -
 100
100 -
 101
101 -
 102
102 -
 103
103 -
 104
104 -
 105
105 -
 106
106 -
 107
107 -
 108
108 -
 109
109 -
 110
110 -
 111
111 -
 112
112 -
 113
113 -
 114
114 -
115
-
116
-
117
-
118
-
119
-
120
-
121
-
122
-
123
-
124
-
125
-
126
-
127
-
128
-
129
-
130
-
131
-
132
-
133
-
134
-
135
-
136
-
137
-
138
-
139
-
140
-
141
-
142
-
143
-
144
-
145
-
146
-
147
-
148
-
149
-
150
-
151
-
152
-
153
-
154
-
155
-
156
-
157
-
158
-
159
-
160
-
161
-
162
-
163
-
164
-
165
-
166
-
167
-
168
-
169
 |
 |

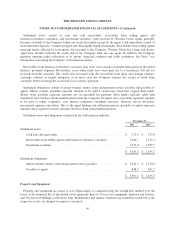
THE WESTERN UNION COMPANY
NOTES TO CONSOLIDATED FINANCIAL STATEMENTS—(Continued)
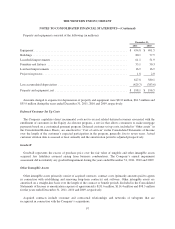
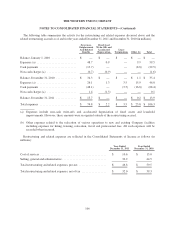
Property and equipment consisted of the following (in millions):
December 31,
2011 2010
Equipment ............................................................... $ 434.8 $ 401.5
Buildings ................................................................ 80.1 77.5
Leasehold improvements .................................................... 61.1 51.9
Furniture and fixtures ...................................................... 33.1 30.3
Land and improvements .................................................... 16.9 16.9
Projects in process ......................................................... 1.8 2.0
627.8 580.1
Less accumulated depreciation ............................................... (429.7) (383.6)
Property and equipment, net ................................................. $ 198.1 $ 196.5
Amounts charged to expense for depreciation of property and equipment were $61.0 million, $61.5 million and
$55.9 million during the years ended December 31, 2011, 2010 and 2009, respectively.
Deferred Customer Set Up Costs
The Company capitalizes direct incremental costs not to exceed related deferred revenues associated with the
enrollment of customers in the Equity Accelerator program, a service that allows consumers to make mortgage
payments based on a customized payment program. Deferred customer set up costs, included in “Other assets” in
the Consolidated Balance Sheets, are amortized to “Cost of services” in the Consolidated Statements of Income
over the length of the customer’s expected participation in the program, generally five to seven years. Actual
customer attrition data is assessed at least annually and the amortization period is adjusted prospectively.
Goodwill
Goodwill represents the excess of purchase price over the fair value of tangible and other intangible assets
acquired, less liabilities assumed arising from business combinations. The Company’s annual impairment
assessment did not identify any goodwill impairment during the years ended December 31, 2011, 2010 and 2009.
Other Intangible Assets
Other intangible assets primarily consist of acquired contracts, contract costs (primarily amounts paid to agents
in connection with establishing and renewing long-term contracts) and software. Other intangible assets are
amortized on a straight-line basis over the length of the contract or benefit periods. Included in the Consolidated
Statements of Income is amortization expense of approximately $131.6 million, $114.4 million and $98.3 million
for the years ended December 31, 2011, 2010 and 2009, respectively.
Acquired contracts include customer and contractual relationships and networks of subagents that are
recognized in connection with the Company’s acquisitions.
97