Western Union 2011 Annual Report Download - page 63
Download and view the complete annual report
Please find page 63 of the 2011 Western Union annual report below. You can navigate through the pages in the report by either clicking on the pages listed below, or by using the keyword search tool below to find specific information within the annual report.-
 1
1 -
2
-
3
-
4
-
5
-
6
-
7
-
8
-
9
-
10
-
11
-
12
-
13
-
14
-
15
-
16
-
17
-
18
-
19
-
20
-
21
-
22
-
23
-
24
-
25
-
26
-
27
-
28
-
29
-
30
-
31
-
32
-
33
-
34
-
35
-
36
-
37
-
38
-
39
-
40
-
41
-
42
-
43
-
44
-
45
-
46
-
47
-
48
-
49
-
50
-
51
-
52
-
 53
53 -
 54
54 -
 55
55 -
 56
56 -
 57
57 -
 58
58 -
 59
59 -
 60
60 -
 61
61 -
 62
62 -
 63
63 -
 64
64 -
 65
65 -
 66
66 -
 67
67 -
 68
68 -
 69
69 -
 70
70 -
 71
71 -
 72
72 -
 73
73 -
74
-
75
-
76
-
77
-
78
-
79
-
80
-
81
-
82
-
83
-
84
-
85
-
86
-
87
-
88
-
89
-
90
-
91
-
92
-
93
-
94
-
95
-
96
-
97
-
98
-
99
-
100
-
101
-
102
-
103
-
104
-
105
-
106
-
107
-
108
-
109
-
110
-
111
-
112
-
113
-
114
-
115
-
116
-
117
-
118
-
119
-
120
-
121
-
122
-
123
-
124
-
125
-
126
-
127
-
128
-
129
-
130
-
131
-
132
-
133
-
134
-
135
-
136
-
137
-
138
-
139
-
140
-
141
-
142
-
143
-
144
-
145
-
146
-
147
-
148
-
149
-
150
-
151
-
152
-
153
-
154
-
155
-
156
-
157
-
158
-
159
-
160
-
161
-
162
-
163
-
164
-
165
-
166
-
167
-
168
-
169
 |
 |
Income taxes
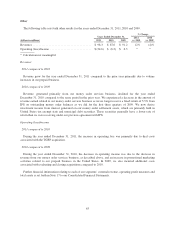
Our effective tax rates on pre-tax income were 8.6%, 20.5% and 25.0% for the years ended December 31,
2011, 2010 and 2009, respectively. The decrease in our effective tax rate for the year ended December 31, 2011
is primarily due to an agreement with the IRS resolving substantially all of the issues related to the restructuring
of our international operations in 2003, as described below, slightly offset by higher taxes associated with the
Finint and Costa remeasurement gains. The tax rate for the year ended December 31, 2010 was impacted by a
cumulative tax planning benefit from certain foreign acquisitions and the settlement with the IRS of certain
issues relating to the 2002-2004 tax years. We continue to benefit from an increasing proportion of profits being
foreign-derived, and therefore taxed at lower rates than our combined federal and state tax rates in the United
States.
In December 2011, we reached an agreement with the IRS resolving substantially all of the issues related to
the restructuring of our international operations in 2003. As a result of the IRS Agreement, we expect to make
cash payments in 2012 of approximately $190 million, which are in addition to the $250 million tax deposit we
made with the IRS in 2010. This deposit limits the further accrual of interest charges with respect to our related
tax liabilities, to the extent of the deposit. The $250 million refundable tax deposit is recorded as a reduction to
“Income taxes payable” in the consolidated balance sheets as of December 31, 2011. Also as a result of the IRS
Agreement, we recognized a tax benefit of $204.7 million related to the adjustment of reserves associated with
this matter. We also expect the settlement with the IRS to result in a lower effective tax rate in future years.
We have established contingency reserves for a variety of material, known tax exposures. As of December 31,
2011, the total amount of tax contingency reserves was $135.0 million, including accrued interest and penalties,
net of related benefits. Our reserves reflect our judgment as to the resolution of the issues involved if subject to
judicial review. While we believe that our reserves are adequate to cover reasonably expected tax risks, there can
be no assurance that, in all instances, an issue raised by a tax authority will be resolved at a financial cost that
does not exceed our related reserve. With respect to these reserves, our income tax expense would include (i) any
changes in tax reserves arising from material changes during the period in facts and circumstances (i.e. new
information) surrounding a tax issue and (ii) any difference from our tax position as recorded in the financial
statements and the final resolution of a tax issue during the period. Such resolution could materially increase or
decrease income tax expense in our consolidated financial statements in future periods and could impact our
operating cash flows.
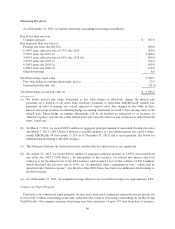
Earnings per share
During the years ended December 31, 2011, 2010 and 2009, basic earnings per share were $1.85, $1.37 and
$1.21, respectively, and diluted earnings per share were $1.84, $1.36 and $1.21, respectively. Unvested shares of
restricted stock are excluded from basic shares outstanding. Diluted earnings per share reflects the potential
dilution that could occur if outstanding stock options at the presented dates are exercised and shares of restricted
stock have vested. As of December 31, 2011, 2010 and 2009, there were 17.1 million, 34.0 million and
37.5 million, respectively, of outstanding options to purchase shares of Western Union stock excluded from the
diluted earnings per share calculation under the treasury stock method as their effect was anti-dilutive.
Of the 30.7 million, 37.5 million and 42.8 million outstanding options to purchase shares of our common stock
as of December 31, 2011, 2010 and 2009, respectively, approximately 32%, 35% and 40%, respectively, were
held by employees of First Data.
Earnings per share increased for the year ended December 31, 2011 compared to the corresponding previous
periods, respectively, as a result of the previously described factors impacting net income, mainly from the tax
related benefit discussed above, and lower weighted-average shares outstanding. Earnings per share increased for
the year ended December 31, 2010 compared to the corresponding previous periods, respectively, as a result of
the previously described factors impacting net income and lower weighted-average shares outstanding. The lower
number of shares outstanding was due to stock repurchases exceeding stock option exercises.
56