Western Union 2011 Annual Report Download - page 112
Download and view the complete annual report
Please find page 112 of the 2011 Western Union annual report below. You can navigate through the pages in the report by either clicking on the pages listed below, or by using the keyword search tool below to find specific information within the annual report.-
 1
1 -
2
-
3
-
4
-
5
-
6
-
7
-
8
-
9
-
10
-
11
-
12
-
13
-
14
-
15
-
16
-
17
-
18
-
19
-
20
-
21
-
22
-
23
-
24
-
25
-
26
-
27
-
28
-
29
-
30
-
31
-
32
-
33
-
34
-
35
-
36
-
37
-
38
-
39
-
40
-
41
-
42
-
43
-
44
-
45
-
46
-
47
-
48
-
49
-
50
-
51
-
52
-
53
-
54
-
55
-
56
-
57
-
58
-
59
-
60
-
61
-
62
-
63
-
64
-
65
-
66
-
67
-
68
-
69
-
70
-
71
-
72
-
73
-
74
-
75
-
76
-
77
-
78
-
79
-
80
-
81
-
82
-
83
-
84
-
85
-
86
-
87
-
88
-
89
-
90
-
91
-
92
-
93
-
94
-
95
-
96
-
97
-
98
-
99
-
100
-
101
-
 102
102 -
 103
103 -
 104
104 -
 105
105 -
 106
106 -
 107
107 -
 108
108 -
 109
109 -
 110
110 -
 111
111 -
 112
112 -
 113
113 -
 114
114 -
 115
115 -
 116
116 -
 117
117 -
 118
118 -
 119
119 -
 120
120 -
 121
121 -
 122
122 -
123
-
124
-
125
-
126
-
127
-
128
-
129
-
130
-
131
-
132
-
133
-
134
-
135
-
136
-
137
-
138
-
139
-
140
-
141
-
142
-
143
-
144
-
145
-
146
-
147
-
148
-
149
-
150
-
151
-
152
-
153
-
154
-
155
-
156
-
157
-
158
-
159
-
160
-
161
-
162
-
163
-
164
-
165
-
166
-
167
-
168
-
169
 |
 |

THE WESTERN UNION COMPANY
NOTES TO CONSOLIDATED FINANCIAL STATEMENTS—(Continued)
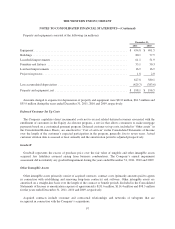
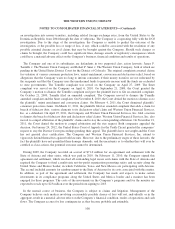
Prior to the acquisition, the Company held a 24.65% interest in FEXCO Group Holdings (“FEXCO Group”),
which was a holding company for both the money transfer business as well as various unrelated businesses. The
Company surrendered its 24.65% interest in FEXCO Group as non-cash consideration, which had an estimated
fair value of $86.2 million on the acquisition date, and paid €123.1 million ($157.4 million) as additional
consideration for all of the common shares of the money transfer business, resulting in a total purchase price of
$243.6 million. The Company recognized no gain or loss in connection with the disposition of its equity interest
in the FEXCO Group, because its estimated fair value approximated its carrying value. The Company recorded
the assets and liabilities of FEXCO at fair value, excluding the deferred tax liability. The valuation of assets
acquired resulted in $74.9 million of identifiable intangible assets, $64.8 million of which were attributable to the
network of subagents, with $10.1 million relating to other intangibles. The subagent network intangible assets are
being amortized over 10 to 15 years, and the remaining intangibles are being amortized over two to three years.
Goodwill of $190.6 million was recognized, of which $91.1 million is expected to be deductible for United States
income tax purposes.
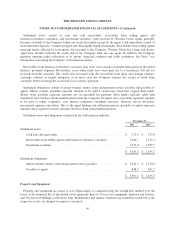
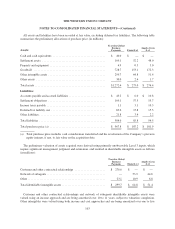
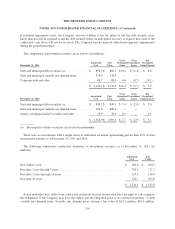
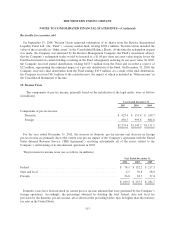
The following table presents changes to goodwill for the years ended December 31, 2011 and 2010 (in millions):
Consumer-to-
Consumer
Global Business
Payments Other Total
January 1, 2010 balance ............................ $ 1,619.9 $ 509.2 $ 14.3 $ 2,143.4
Purchase price adjustments .......................... — (7.9) — (7.9)
Currency translation ............................... — 16.3 (0.1) 16.2
December 31, 2010 balance ......................... $ 1,619.9 $ 517.6 $ 14.2 $ 2,151.7
Acquisitions ...................................... 325.4 728.7 — 1,054.1
Currency translation ............................... — (6.7) (0.2) (6.9)
December 31, 2011 balance ......................... $ 1,945.3 $1,239.6 $ 14.0 $ 3,198.9
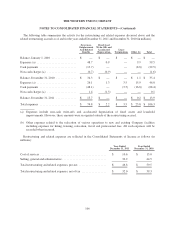
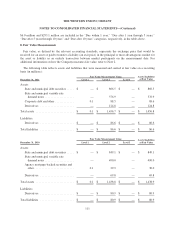
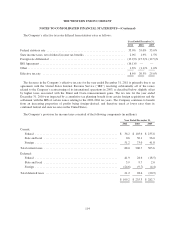
4. Restructuring and Related Expenses
On May 25, 2010 and as subsequently revised, the Company’s Board of Directors approved a restructuring
plan (the “Restructuring Plan”) designed to reduce the Company’s overall headcount and migrate positions from
various facilities, primarily within North America and Europe, to regional operating centers. Details of the
expenses incurred are included in the tables below. Included in these expenses are approximately $2 million of
non-cash expenses related to fixed asset and leasehold improvement write-offs and accelerated depreciation at
impacted facilities. As of December 31, 2011, the Company has incurred all of the expenses related to the
Restructuring Plan.
105