Western Union 2011 Annual Report Download - page 67
Download and view the complete annual report
Please find page 67 of the 2011 Western Union annual report below. You can navigate through the pages in the report by either clicking on the pages listed below, or by using the keyword search tool below to find specific information within the annual report.-
 1
1 -
2
-
3
-
4
-
5
-
6
-
7
-
8
-
9
-
10
-
11
-
12
-
13
-
14
-
15
-
16
-
17
-
18
-
19
-
20
-
21
-
22
-
23
-
24
-
25
-
26
-
27
-
28
-
29
-
30
-
31
-
32
-
33
-
34
-
35
-
36
-
37
-
38
-
39
-
40
-
41
-
42
-
43
-
44
-
45
-
46
-
47
-
48
-
49
-
50
-
51
-
52
-
53
-
54
-
55
-
56
-
 57
57 -
 58
58 -
 59
59 -
 60
60 -
 61
61 -
 62
62 -
 63
63 -
 64
64 -
 65
65 -
 66
66 -
 67
67 -
 68
68 -
 69
69 -
 70
70 -
 71
71 -
 72
72 -
 73
73 -
 74
74 -
 75
75 -
 76
76 -
 77
77 -
78
-
79
-
80
-
81
-
82
-
83
-
84
-
85
-
86
-
87
-
88
-
89
-
90
-
91
-
92
-
93
-
94
-
95
-
96
-
97
-
98
-
99
-
100
-
101
-
102
-
103
-
104
-
105
-
106
-
107
-
108
-
109
-
110
-
111
-
112
-
113
-
114
-
115
-
116
-
117
-
118
-
119
-
120
-
121
-
122
-
123
-
124
-
125
-
126
-
127
-
128
-
129
-
130
-
131
-
132
-
133
-
134
-
135
-
136
-
137
-
138
-
139
-
140
-
141
-
142
-
143
-
144
-
145
-
146
-
147
-
148
-
149
-
150
-
151
-
152
-
153
-
154
-
155
-
156
-
157
-
158
-
159
-
160
-
161
-
162
-
163
-
164
-
165
-
166
-
167
-
168
-
169
 |
 |
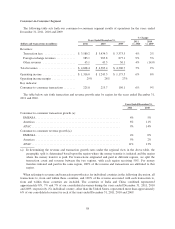
The majority of transaction growth is derived from more mature agent locations; new agent locations typically
contribute only marginally to growth in the first few years of their operation. Increased productivity, measured by
transactions per location, is often experienced as locations mature. We believe that new agent locations will help
our growth by increasing the number of locations available to send and receive money. We generally refer to
locations with more than 50% of transactions being initiated (versus paid) as “send locations” and to the balance
of locations as “receive locations.” Send locations are the engine that drives consumer-to-consumer revenue.
They contribute more transactions per location than receive locations. However, a wide network of receive
locations is necessary to build each corridor and to help ensure global distribution and convenience for
consumers. The number of send and receive transactions at an agent location can vary significantly due to such
factors as customer demographics around the location, migration patterns, the location’s class of trade, hours of
operation, length of time the location has been offering our services, regulatory limitations and competition. Each
of the more than 485,000 agent locations in our agent network is capable of providing one or more of our
services; however, not every location completes a transaction in a given period. For example, as of December 31,
2011, more than 85% of agent locations in the United States, Canada and Western Europe (representing at least
one of our three money transfer brands: Western Union®, Orlandi Valuta(SM) and Vigo®) experienced money
transfer activity in the previous 12 months. In the developing regions of Asia and other areas where there are
primarily receive locations, approximately 65% of locations experienced money transfer activity in the previous
12 months. We periodically review locations to determine whether they remain enabled to perform money
transfer transactions.
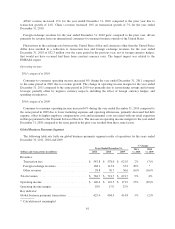
2010 compared to 2009
For the year ended December 31, 2010 compared to the prior year, consumer-to-consumer money transfer
revenue grew 2% primarily due to transaction growth of 9%. Transaction growth was offset by price decreases,
primarily related to pricing reductions taken in the domestic business commencing in the fourth quarter of 2009,
geographic and product mix, including a higher percentage of revenue earned from intra-country activity, and the
strengthening of the United States dollar compared to most other foreign currencies, which negatively impacted
revenue by approximately 1%. Our international consumer-to-consumer business experienced revenue growth of
3% on transaction growth of 8% for the year ended December 31, 2010. Our international business represents all
transactions other than transactions between and within the United States and Canada and transactions to and
from Mexico. Our international consumer-to-consumer business outside of the United States also experienced
revenue growth on transaction increases for the year ended December 31, 2010.
Revenue in our EMEASA region remained flat during the year ended December 31, 2010 compared to the
prior year despite transaction growth of 5%. Transaction growth was offset by the strengthening of the United
States dollar compared to most other foreign currencies in the region and many of the same factors described
above. Our European market experienced transaction growth during the year ended December 31, 2010
compared to the prior year. In addition, for the full year ended December 31, 2010, revenue and transactions in
the Gulf States declined moderately compared to the same period in 2009, however, both revenue and
transactions grew in the fourth quarter of 2010 compared to the comparable period in the prior year. India had
transaction growth of 4% and revenue growth of 5% for the year ended December 31, 2010 versus the same
period in 2009.
Americas revenue increased 2% on transaction growth of 11% for the year ended December 31, 2010
compared to the prior year due to the pricing actions taken in the domestic business commencing in the fourth
quarter of 2009. Our domestic business experienced revenue declines of 6% on transaction growth of 28% for the
year ended December 31, 2010 due to the same factors. However, in the fourth quarter of 2010, our domestic
business experienced revenue growth of 7% on transaction growth of 29% as we reached the anniversary of the
pricing reductions taken in the fourth quarter of 2009. Our United States outbound business experienced both
transaction and revenue growth in the year ended December 31, 2010. Our Mexico business revenue was flat
during the year ended December 31, 2010 on transaction growth of 2%.
60