Western Union 2011 Annual Report Download - page 137
Download and view the complete annual report
Please find page 137 of the 2011 Western Union annual report below. You can navigate through the pages in the report by either clicking on the pages listed below, or by using the keyword search tool below to find specific information within the annual report.-
 1
1 -
2
-
3
-
4
-
5
-
6
-
7
-
8
-
9
-
10
-
11
-
12
-
13
-
14
-
15
-
16
-
17
-
18
-
19
-
20
-
21
-
22
-
23
-
24
-
25
-
26
-
27
-
28
-
29
-
30
-
31
-
32
-
33
-
34
-
35
-
36
-
37
-
38
-
39
-
40
-
41
-
42
-
43
-
44
-
45
-
46
-
47
-
48
-
49
-
50
-
51
-
52
-
53
-
54
-
55
-
56
-
57
-
58
-
59
-
60
-
61
-
62
-
63
-
64
-
65
-
66
-
67
-
68
-
69
-
70
-
71
-
72
-
73
-
74
-
75
-
76
-
77
-
78
-
79
-
80
-
81
-
82
-
83
-
84
-
85
-
86
-
87
-
88
-
89
-
90
-
91
-
92
-
93
-
94
-
95
-
96
-
97
-
98
-
99
-
100
-
101
-
102
-
103
-
104
-
105
-
106
-
107
-
108
-
109
-
110
-
111
-
112
-
113
-
114
-
115
-
116
-
117
-
118
-
119
-
120
-
121
-
122
-
123
-
124
-
125
-
126
-
 127
127 -
 128
128 -
 129
129 -
 130
130 -
 131
131 -
 132
132 -
 133
133 -
 134
134 -
 135
135 -
 136
136 -
 137
137 -
 138
138 -
 139
139 -
 140
140 -
 141
141 -
 142
142 -
 143
143 -
 144
144 -
 145
145 -
 146
146 -
 147
147 -
148
-
149
-
150
-
151
-
152
-
153
-
154
-
155
-
156
-
157
-
158
-
159
-
160
-
161
-
162
-
163
-
164
-
165
-
166
-
167
-
168
-
169
 |
 |

THE WESTERN UNION COMPANY
NOTES TO CONSOLIDATED FINANCIAL STATEMENTS—(Continued)
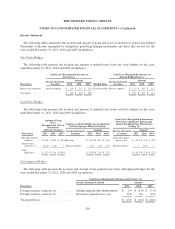
Income Statement
The following tables summarize the location and amount of gains and losses of derivatives in the Consolidated
Statements of Income segregated by designated, qualifying hedging instruments and those that are not, for the
years ended December 31, 2011, 2010 and 2009 (in millions):
Fair Value Hedges
The following table presents the location and amount of gains/(losses) from fair value hedges for the years
ended December 31, 2011, 2010 and 2009 (in millions):
Gain/(Loss) Recognized in Income on
Derivatives
Gain/(Loss) Recognized in Income on
Related Hedged Item (a)
Income Statement
Location
Amount Income Statement
Location
Amount
Derivatives 2011 2010 2009 Hedged Items 2011 2010 2009
Interest rate contracts . . . Interest expense $ 11.8 $ 13.3 $ 12.9 Fixed-rate debt Interest expense $ 12.6 $ 10.5 $ 11.1
Total gain ............ $ 11.8 $ 13.3 $ 12.9 $ 12.6 $ 10.5 $ 11.1
Cash Flow Hedges
The following table presents the location and amount of gains/(losses) from cash flow hedges for the years
ended December 31, 2011, 2010 and 2009 (in millions):
Amount of Gain/
(Loss)
Recognized in OCI on
Derivatives
(Effective Portion)
Gain/(Loss) Reclassified from Accumulated
OCI into Income (Effective Portion)
Gain/(Loss) Recognized in Income on
Derivatives (Ineffective Portion and
Amount Excluded from Effectiveness
Testing) (b)
Income Statement
Location
Amount Income Statement
Location
Amount
Derivatives 2011 2010 2009 2011 2010 2009 2011 2010 2009
Foreign currency
contracts ...... $ 16.4 $ 20.0 $ (43.6) Revenue $ (30.3) $ 24.5 $ 34.6
Derivative gains/
(losses), net $ (10.2) $ (1.5) $ (1.2)
Interest rate
contracts (c) . . . (21.6) (4.2) — Interest expense (2.7) (1.5) (1.7) Interest expense — (0.1) —
Total
gain/(loss) ..... $ (5.2) $ 15.8 $ (43.6) $ (33.0) $ 23.0 $ 32.9 $ (10.2) $ (1.6) $ (1.2)
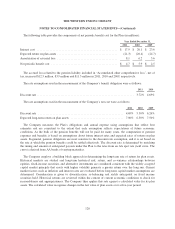
Undesignated Hedges
The following table presents the location and amount of net gains/(losses) from undesignated hedges for the
years ended December 31, 2011, 2010 and 2009 (in millions):
Gain/(Loss) Recognized in Income on Derivatives (d)
Income Statement Location Amount
Derivatives 2011 2010 2009
Foreign currency contracts (e) ........... Selling, general and administrative $ 5.9 $ (1.0) $ (7.4)
Foreign currency contracts (f) ............ Derivative gains/(losses), net 21.9 0.6 (2.8)
Total gain/(loss) ...................... $ 27.8 $ (0.4) $ (10.2)
130