Western Union 2011 Annual Report Download - page 136
Download and view the complete annual report
Please find page 136 of the 2011 Western Union annual report below. You can navigate through the pages in the report by either clicking on the pages listed below, or by using the keyword search tool below to find specific information within the annual report.-
 1
1 -
2
-
3
-
4
-
5
-
6
-
7
-
8
-
9
-
10
-
11
-
12
-
13
-
14
-
15
-
16
-
17
-
18
-
19
-
20
-
21
-
22
-
23
-
24
-
25
-
26
-
27
-
28
-
29
-
30
-
31
-
32
-
33
-
34
-
35
-
36
-
37
-
38
-
39
-
40
-
41
-
42
-
43
-
44
-
45
-
46
-
47
-
48
-
49
-
50
-
51
-
52
-
53
-
54
-
55
-
56
-
57
-
58
-
59
-
60
-
61
-
62
-
63
-
64
-
65
-
66
-
67
-
68
-
69
-
70
-
71
-
72
-
73
-
74
-
75
-
76
-
77
-
78
-
79
-
80
-
81
-
82
-
83
-
84
-
85
-
86
-
87
-
88
-
89
-
90
-
91
-
92
-
93
-
94
-
95
-
96
-
97
-
98
-
99
-
100
-
101
-
102
-
103
-
104
-
105
-
106
-
107
-
108
-
109
-
110
-
111
-
112
-
113
-
114
-
115
-
116
-
117
-
118
-
119
-
120
-
121
-
122
-
123
-
124
-
125
-
 126
126 -
 127
127 -
 128
128 -
 129
129 -
 130
130 -
 131
131 -
 132
132 -
 133
133 -
 134
134 -
 135
135 -
 136
136 -
 137
137 -
 138
138 -
 139
139 -
 140
140 -
 141
141 -
 142
142 -
 143
143 -
 144
144 -
 145
145 -
 146
146 -
147
-
148
-
149
-
150
-
151
-
152
-
153
-
154
-
155
-
156
-
157
-
158
-
159
-
160
-
161
-
162
-
163
-
164
-
165
-
166
-
167
-
168
-
169
 |
 |

THE WESTERN UNION COMPANY
NOTES TO CONSOLIDATED FINANCIAL STATEMENTS—(Continued)
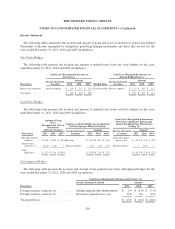
Balance Sheet
The following table summarizes the fair value of derivatives reported in the Consolidated Balance Sheets as of
December 31, 2011 and 2010 (in millions):
Derivative Assets Derivative Liabilities
Balance Sheet
Location
Fair Value Balance Sheet
Location
Fair Value
2011 2010 2011 2010
Derivatives—hedges:
Interest rate fair value hedges—
Corporate ....................... Other assets $ 4.4 $ 8.0 Other liabilities $ — $ 1.6
Foreign currency cash flow hedges—
Consumer-to-consumer ............ Other assets 37.0 14.7 Other liabilities 6.6 31.1
Total ............................ $ 41.4 $ 22.7 $ 6.6 $ 32.7
Derivatives—undesignated:
Foreign currency—Global business
payments ....................... Other assets $ 79.8 $ 46.9 Other liabilities $ 67.6 $ 36.2
Foreign currency—
Consumer-to-consumer ............ Other assets 3.6 0.2 Other liabilities 12.4 12.0
Total ............................ $ 83.4 $ 47.1 $ 80.0 $ 48.2
Total derivatives ....................... $ 124.8 $ 69.8 $ 86.6 $ 80.9
The following table summarizes the net fair value of derivatives held as of December 31, 2011 and their
expected maturities (in millions):
Total 2012 2013 2014 Thereafter
Foreign currency undesignated hedges—
Consumer-to-consumer ........................... $ (8.8) $ (4.8) $ (4.0) $ — $ —
Interest rate fair value hedges—Corporate ............... 4.4 — — 4.4 —
Foreign currency undesignated hedges—Global business
payments ....................................... 12.2 12.3 (0.1) — —
Foreign currency cash flow hedges—
Consumer-to-consumer ........................... 30.4 15.4 15.0 — —
Total ............................................ $ 38.2 $ 22.9 $ 10.9 $ 4.4 $ —
129