Western Union 2011 Annual Report Download - page 155
Download and view the complete annual report
Please find page 155 of the 2011 Western Union annual report below. You can navigate through the pages in the report by either clicking on the pages listed below, or by using the keyword search tool below to find specific information within the annual report.-
 1
1 -
2
-
3
-
4
-
5
-
6
-
7
-
8
-
9
-
10
-
11
-
12
-
13
-
14
-
15
-
16
-
17
-
18
-
19
-
20
-
21
-
22
-
23
-
24
-
25
-
26
-
27
-
28
-
29
-
30
-
31
-
32
-
33
-
34
-
35
-
36
-
37
-
38
-
39
-
40
-
41
-
42
-
43
-
44
-
45
-
46
-
47
-
48
-
49
-
50
-
51
-
52
-
53
-
54
-
55
-
56
-
57
-
58
-
59
-
60
-
61
-
62
-
63
-
64
-
65
-
66
-
67
-
68
-
69
-
70
-
71
-
72
-
73
-
74
-
75
-
76
-
77
-
78
-
79
-
80
-
81
-
82
-
83
-
84
-
85
-
86
-
87
-
88
-
89
-
90
-
91
-
92
-
93
-
94
-
95
-
96
-
97
-
98
-
99
-
100
-
101
-
102
-
103
-
104
-
105
-
106
-
107
-
108
-
109
-
110
-
111
-
112
-
113
-
114
-
115
-
116
-
117
-
118
-
119
-
120
-
121
-
122
-
123
-
124
-
125
-
126
-
127
-
128
-
129
-
130
-
131
-
132
-
133
-
134
-
135
-
136
-
137
-
138
-
139
-
140
-
141
-
142
-
143
-
144
-
 145
145 -
 146
146 -
 147
147 -
 148
148 -
 149
149 -
 150
150 -
 151
151 -
 152
152 -
 153
153 -
 154
154 -
 155
155 -
 156
156 -
 157
157 -
 158
158 -
 159
159 -
 160
160 -
 161
161 -
 162
162 -
 163
163 -
 164
164 -
 165
165 -
166
-
167
-
168
-
169
 |
 |

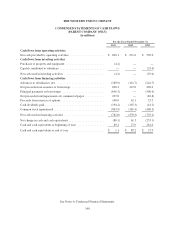
THE WESTERN UNION COMPANY
CONDENSED STATEMENTS OF CASH FLOWS
(PARENT COMPANY ONLY)
(in millions)
For the Years Ended December 31,
2011 2010 2009
Cash flows from operating activities
Net cash provided by operating activities ....................... $ 698.1 $ 631.6 $ 505.0
Cash flows from investing activities
Purchases of property and equipment .......................... (4.2) — —
Capital contributed to subsidiary .............................. — — (29.0)
Net cash used in investing activities ........................... (4.2) — (29.0)
Cash flows from financing activities
Advances to subsidiaries, net ................................. (180.9) (112.7) (224.7)
Net proceeds from issuance of borrowings ...................... 696.3 247.0 496.6
Principal payments on borrowings ............................ (696.3) — (500.0)
Net proceeds from/(repayments of) commercial paper ............. 297.0 — (82.8)
Proceeds from exercise of options ............................. 100.0 42.1 23.2
Cash dividends paid ........................................ (194.2) (165.3) (41.2)
Common stock repurchased .................................. (803.9) (581.4) (400.2)
Net cash used in financing activities ........................... (782.0) (570.3) (729.1)
Net change in cash and cash equivalents ........................ (88.1) 61.3 (253.1)
Cash and cash equivalents at beginning of year .................. 89.2 27.9 281.0
Cash and cash equivalents at end of year ....................... $ 1.1 $ 89.2 $ 27.9
See Notes to Condensed Financial Statements.
148