Western Union 2011 Annual Report Download - page 60
Download and view the complete annual report
Please find page 60 of the 2011 Western Union annual report below. You can navigate through the pages in the report by either clicking on the pages listed below, or by using the keyword search tool below to find specific information within the annual report.-
 1
1 -
2
-
3
-
4
-
5
-
6
-
7
-
8
-
9
-
10
-
11
-
12
-
13
-
14
-
15
-
16
-
17
-
18
-
19
-
20
-
21
-
22
-
23
-
24
-
25
-
26
-
27
-
28
-
29
-
30
-
31
-
32
-
33
-
34
-
35
-
36
-
37
-
38
-
39
-
40
-
41
-
42
-
43
-
44
-
45
-
46
-
47
-
48
-
49
-
 50
50 -
 51
51 -
 52
52 -
 53
53 -
 54
54 -
 55
55 -
 56
56 -
 57
57 -
 58
58 -
 59
59 -
 60
60 -
 61
61 -
 62
62 -
 63
63 -
 64
64 -
 65
65 -
 66
66 -
 67
67 -
 68
68 -
 69
69 -
 70
70 -
71
-
72
-
73
-
74
-
75
-
76
-
77
-
78
-
79
-
80
-
81
-
82
-
83
-
84
-
85
-
86
-
87
-
88
-
89
-
90
-
91
-
92
-
93
-
94
-
95
-
96
-
97
-
98
-
99
-
100
-
101
-
102
-
103
-
104
-
105
-
106
-
107
-
108
-
109
-
110
-
111
-
112
-
113
-
114
-
115
-
116
-
117
-
118
-
119
-
120
-
121
-
122
-
123
-
124
-
125
-
126
-
127
-
128
-
129
-
130
-
131
-
132
-
133
-
134
-
135
-
136
-
137
-
138
-
139
-
140
-
141
-
142
-
143
-
144
-
145
-
146
-
147
-
148
-
149
-
150
-
151
-
152
-
153
-
154
-
155
-
156
-
157
-
158
-
159
-
160
-
161
-
162
-
163
-
164
-
165
-
166
-
167
-
168
-
169
 |
 |
compared to most other foreign currencies positively impacted revenue growth by approximately 1% in the year
ended December 31, 2011. The acquisition of TGBP contributed $35.2 million or 1% of revenue for the year
ended December 31, 2011.
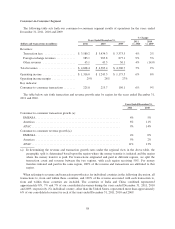
The Europe, Middle East, Africa and South Asia (“EMEASA”) region of our consumer-to-consumer segment,
which represented 43% of our total consolidated revenue for the year ended December 31, 2011, experienced
revenue growth primarily driven by most of the same factors described above. The United Kingdom, France,
Germany, and the Gulf States continued to experience revenue growth during the year ended December 31, 2011,
which was partially offset by softness in Southern Europe and Russia and declines resulting from the political
unrest in Libya and the Ivory Coast.
The Americas region (including North America, Central America, the Caribbean and South America) of our
consumer-to-consumer segment, which represented 32% of our total consolidated revenue for the year ended
December 31, 2011, experienced revenue growth due to transaction growth, slightly offset by pricing reductions.
Foreign exchange revenues increased for the year ended December 31, 2011 compared to the same period in
2010 primarily due to increasing foreign exchange revenues in our consumer-to-consumer segment, driven
primarily by the increased amount of cross-border principal sent. Additionally, foreign exchange revenues were
positively impacted by the acquisition of TGBP and revenue growth experienced in our existing Business
Solutions business.
Fluctuations in the exchange rate between the United States dollar and currencies other than the United States
dollar have resulted in a benefit to transaction fees and foreign exchange revenues for the year ended
December 31, 2011 of $38.0 million over the previous year, net of foreign currency hedges, that would not have
occurred had there been constant currency rates. The largest benefit was related to the EMEASA region.
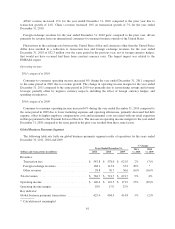
2010 compared to 2009
Consolidated revenue increased 2% during the year ended December 31, 2010 due to consumer-to-consumer
transaction growth and the acquisition of Custom House, which contributed $111.0 million to revenue in 2010
and $30.8 million in 2009. Transaction growth and incremental Custom House revenue were offset by price
decreases, primarily related to pricing reductions taken in the domestic business (transactions between and within
the United States and Canada) commencing in the fourth quarter of 2009, declines in our United States bill
payments businesses, geographic and product mix, including a higher percentage of revenue earned from intra-
country activity, which has a lower revenue per transaction, and the strengthening of the United States dollar
compared to most other foreign currencies, which negatively impacted revenue.
The EMEASA region of our consumer-to-consumer segment, which represented 44% of our total consolidated
revenue for the year ended December 31, 2010, experienced flat revenue despite transaction growth. Transaction
growth was offset by the strengthening of the United States dollar in the region compared to most other foreign
currencies, which negatively impacted revenue, and many of the same factors described above.
The Americas region of our consumer-to-consumer segment, which represented 31% of our total consolidated
revenue for the year ended December 31, 2010, experienced revenue increases due to strong transaction growth,
although the increase was mostly offset by the impact of pricing actions taken in our domestic business in the
fourth quarter of 2009.
The global business payments segment, which is discussed in greater detail in “Segment Discussion,” also
experienced revenue growth during the year ended December 31, 2010 compared to the prior year due to our
acquisition of Custom House, which was partially offset by declines in our United States cash-based bill
payments businesses.
53