Western Union 2011 Annual Report Download - page 145
Download and view the complete annual report
Please find page 145 of the 2011 Western Union annual report below. You can navigate through the pages in the report by either clicking on the pages listed below, or by using the keyword search tool below to find specific information within the annual report.-
 1
1 -
2
-
3
-
4
-
5
-
6
-
7
-
8
-
9
-
10
-
11
-
12
-
13
-
14
-
15
-
16
-
17
-
18
-
19
-
20
-
21
-
22
-
23
-
24
-
25
-
26
-
27
-
28
-
29
-
30
-
31
-
32
-
33
-
34
-
35
-
36
-
37
-
38
-
39
-
40
-
41
-
42
-
43
-
44
-
45
-
46
-
47
-
48
-
49
-
50
-
51
-
52
-
53
-
54
-
55
-
56
-
57
-
58
-
59
-
60
-
61
-
62
-
63
-
64
-
65
-
66
-
67
-
68
-
69
-
70
-
71
-
72
-
73
-
74
-
75
-
76
-
77
-
78
-
79
-
80
-
81
-
82
-
83
-
84
-
85
-
86
-
87
-
88
-
89
-
90
-
91
-
92
-
93
-
94
-
95
-
96
-
97
-
98
-
99
-
100
-
101
-
102
-
103
-
104
-
105
-
106
-
107
-
108
-
109
-
110
-
111
-
112
-
113
-
114
-
115
-
116
-
117
-
118
-
119
-
120
-
121
-
122
-
123
-
124
-
125
-
126
-
127
-
128
-
129
-
130
-
131
-
132
-
133
-
134
-
 135
135 -
 136
136 -
 137
137 -
 138
138 -
 139
139 -
 140
140 -
 141
141 -
 142
142 -
 143
143 -
 144
144 -
 145
145 -
 146
146 -
 147
147 -
 148
148 -
 149
149 -
 150
150 -
 151
151 -
 152
152 -
 153
153 -
 154
154 -
 155
155 -
156
-
157
-
158
-
159
-
160
-
161
-
162
-
163
-
164
-
165
-
166
-
167
-
168
-
169
 |
 |

THE WESTERN UNION COMPANY
NOTES TO CONSOLIDATED FINANCIAL STATEMENTS—(Continued)
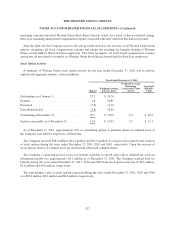
Restricted Stock Activity
A summary of Western Union activity for restricted stock units, performance based restricted stock units, and
restricted stock awards for the year ended December 31, 2011 is listed below (awards/units in millions):
Year Ended
December 31, 2011
Number
Outstanding
Weighted-Average
Grant-Date Fair Value
Non-vested as of January 1, ........................................ 2.7 $ 15.34
Granted ........................................................ 2.1 19.59
Vested ......................................................... (0.4) 20.92
Forfeited ....................................................... (0.5) 16.94
Non-vested as of December 31, ..................................... 3.9 $ 16.85
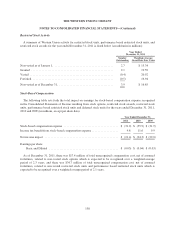
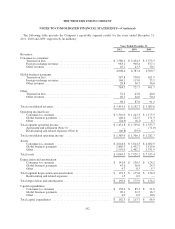
Stock-Based Compensation
The following table sets forth the total impact on earnings for stock-based compensation expense recognized
in the Consolidated Statements of Income resulting from stock options, restricted stock awards, restricted stock
units, performance based restricted stock units and deferred stock units for the years ended December 31, 2011,
2010 and 2009 (in millions, except per share data).
Year Ended December 31,
2011 2010 2009
Stock-based compensation expense ..................................... $ (31.2) $ (35.9) $ (31.9)
Income tax benefit from stock-based compensation expense .................. 9.8 11.6 9.9
Net income impact .................................................. $ (21.4) $ (24.3) $ (22.0)
Earnings per share:
Basic and Diluted ............................................... $ (0.03) $ (0.04) $ (0.03)
As of December 31, 2011, there was $17.4 million of total unrecognized compensation cost, net of assumed
forfeitures, related to non-vested stock options which is expected to be recognized over a weighted-average
period of 2.3 years, and there was $34.7 million of total unrecognized compensation cost, net of assumed
forfeitures, related to non-vested restricted stock units and performance based restricted stock units which is
expected to be recognized over a weighted-average period of 2.1 years.
138