Western Union 2011 Annual Report Download - page 69
Download and view the complete annual report
Please find page 69 of the 2011 Western Union annual report below. You can navigate through the pages in the report by either clicking on the pages listed below, or by using the keyword search tool below to find specific information within the annual report.-
 1
1 -
2
-
3
-
4
-
5
-
6
-
7
-
8
-
9
-
10
-
11
-
12
-
13
-
14
-
15
-
16
-
17
-
18
-
19
-
20
-
21
-
22
-
23
-
24
-
25
-
26
-
27
-
28
-
29
-
30
-
31
-
32
-
33
-
34
-
35
-
36
-
37
-
38
-
39
-
40
-
41
-
42
-
43
-
44
-
45
-
46
-
47
-
48
-
49
-
50
-
51
-
52
-
53
-
54
-
55
-
56
-
57
-
58
-
 59
59 -
 60
60 -
 61
61 -
 62
62 -
 63
63 -
 64
64 -
 65
65 -
 66
66 -
 67
67 -
 68
68 -
 69
69 -
 70
70 -
 71
71 -
 72
72 -
 73
73 -
 74
74 -
 75
75 -
 76
76 -
 77
77 -
 78
78 -
 79
79 -
80
-
81
-
82
-
83
-
84
-
85
-
86
-
87
-
88
-
89
-
90
-
91
-
92
-
93
-
94
-
95
-
96
-
97
-
98
-
99
-
100
-
101
-
102
-
103
-
104
-
105
-
106
-
107
-
108
-
109
-
110
-
111
-
112
-
113
-
114
-
115
-
116
-
117
-
118
-
119
-
120
-
121
-
122
-
123
-
124
-
125
-
126
-
127
-
128
-
129
-
130
-
131
-
132
-
133
-
134
-
135
-
136
-
137
-
138
-
139
-
140
-
141
-
142
-
143
-
144
-
145
-
146
-
147
-
148
-
149
-
150
-
151
-
152
-
153
-
154
-
155
-
156
-
157
-
158
-
159
-
160
-
161
-
162
-
163
-
164
-
165
-
166
-
167
-
168
-
169
 |
 |
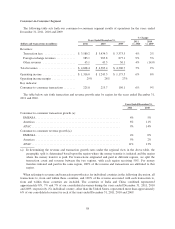
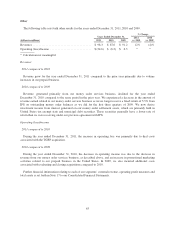
Revenues
2011 compared to 2010
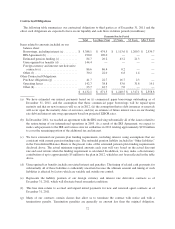
During the year ended December 31, 2011, global business payments segment revenue was positively
impacted by our acquisition of TGBP, which contributed $35.2 million of revenue, primarily included in foreign
exchange revenues, and revenue growth in international bill payments, Business Solutions, and United States
electronic bill payments, partially offset by a decline in United States cash-based bill payments.
Transaction growth during the year ended December 31, 2011 compared to the same period in 2010 was due to
growth in our international bill payments and United States electronic bill payments businesses.
2010 compared to 2009
During the year ended December 31, 2010, global business payments segment revenue was positively
impacted by our acquisition of Custom House, which contributed $111.0 million of revenue in 2010 versus
$30.8 million in 2009, primarily included in foreign exchange revenues, and growth in the Pago Fácil business.
These increases were offset by revenue declines in our United States cash-based bill payments businesses as
many United States consumers who would use our services continued to have difficulty paying their bills and
continue to be unable to obtain credit in any form, resulting in us handling fewer bill payments. The ongoing
trend away from cash based bill payments in the United States and competitive pressures, which resulted in lower
cash and electronic volumes and a shift to lower revenue per transaction products, also contributed to the revenue
declines.
The transaction declines during the year ended December 31, 2010 compared to the same period in 2009 were
due to declines in our United States bill payments businesses.
Operating income
2011 compared to 2010
For the year ended December 31, 2011, operating income increased compared to the prior year primarily due
to revenue increases, a decrease in integration expenses related to the acquisition of Custom House, decreased
debit card bank fees due to the recent Durbin legislation, and restructuring savings, partially offset by declines in
our United States cash-based bill payments business, which has a higher margin than other payment services in
the segment, and integration and amortization expenses related to the acquisition of TGBP.
The changes in operating income margins in the segment are due to the same factors mentioned above.
2010 compared to 2009
For the year ended December 31, 2010, operating income decreased compared to the same period in the prior
year primarily due to declines related to the United States cash-based bill payments business, and investing and
operating costs, including amortization expense, associated with the acquisition of Custom House.
The decline in operating income margin in the segment is primarily due to the increased costs associated with
the acquisition of Custom House and declines in our United States cash-based bill payments business.
62