Western Union 2011 Annual Report Download - page 150
Download and view the complete annual report
Please find page 150 of the 2011 Western Union annual report below. You can navigate through the pages in the report by either clicking on the pages listed below, or by using the keyword search tool below to find specific information within the annual report.-
 1
1 -
2
-
3
-
4
-
5
-
6
-
7
-
8
-
9
-
10
-
11
-
12
-
13
-
14
-
15
-
16
-
17
-
18
-
19
-
20
-
21
-
22
-
23
-
24
-
25
-
26
-
27
-
28
-
29
-
30
-
31
-
32
-
33
-
34
-
35
-
36
-
37
-
38
-
39
-
40
-
41
-
42
-
43
-
44
-
45
-
46
-
47
-
48
-
49
-
50
-
51
-
52
-
53
-
54
-
55
-
56
-
57
-
58
-
59
-
60
-
61
-
62
-
63
-
64
-
65
-
66
-
67
-
68
-
69
-
70
-
71
-
72
-
73
-
74
-
75
-
76
-
77
-
78
-
79
-
80
-
81
-
82
-
83
-
84
-
85
-
86
-
87
-
88
-
89
-
90
-
91
-
92
-
93
-
94
-
95
-
96
-
97
-
98
-
99
-
100
-
101
-
102
-
103
-
104
-
105
-
106
-
107
-
108
-
109
-
110
-
111
-
112
-
113
-
114
-
115
-
116
-
117
-
118
-
119
-
120
-
121
-
122
-
123
-
124
-
125
-
126
-
127
-
128
-
129
-
130
-
131
-
132
-
133
-
134
-
135
-
136
-
137
-
138
-
139
-
 140
140 -
 141
141 -
 142
142 -
 143
143 -
 144
144 -
 145
145 -
 146
146 -
 147
147 -
 148
148 -
 149
149 -
 150
150 -
 151
151 -
 152
152 -
 153
153 -
 154
154 -
 155
155 -
 156
156 -
 157
157 -
 158
158 -
 159
159 -
 160
160 -
161
-
162
-
163
-
164
-
165
-
166
-
167
-
168
-
169
 |
 |

THE WESTERN UNION COMPANY
NOTES TO CONSOLIDATED FINANCIAL STATEMENTS—(Continued)
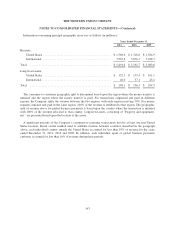
Information concerning principal geographic areas was as follows (in millions):
Years Ended December 31,
2011 2010 2009
Revenue:
United States .............................................. $ 1,568.6 $ 1,516.0 $ 1,584.9
International .............................................. 3,922.8 3,676.7 3,498.7
Total ........................................................ $ 5,491.4 $ 5,192.7 $ 5,083.6
Long-lived assets:
United States .............................................. $ 152.1 $ 159.4 $ 161.1
International .............................................. 46.0 37.1 43.2
Total ........................................................ $ 198.1 $ 196.5 $ 204.3
The consumer-to-consumer geographic split is determined based upon the region where the money transfer is
initiated and the region where the money transfer is paid. For transactions originated and paid in different
regions, the Company splits the revenue between the two regions, with each region receiving 50%. For money
transfers initiated and paid in the same region, 100% of the revenue is attributed to that region. The geographic
split of revenue above for global business payments is based upon the country where the transaction is initiated
with 100% of the revenue allocated to that country. Long-lived assets, consisting of “Property and equipment,
net,” are presented based upon the location of the assets.
A significant majority of the Company’s consumer-to-consumer transactions involve at least one non-United
States location. Based on the method used to attribute revenue between countries described in the paragraph
above, each individual country outside the United States accounted for less than 10% of revenue for the years
ended December 31, 2011, 2010 and 2009. In addition, each individual agent or global business payments
customer accounted for less than 10% of revenue during these periods.
143