Western Union 2011 Annual Report Download - page 127
Download and view the complete annual report
Please find page 127 of the 2011 Western Union annual report below. You can navigate through the pages in the report by either clicking on the pages listed below, or by using the keyword search tool below to find specific information within the annual report.-
 1
1 -
2
-
3
-
4
-
5
-
6
-
7
-
8
-
9
-
10
-
11
-
12
-
13
-
14
-
15
-
16
-
17
-
18
-
19
-
20
-
21
-
22
-
23
-
24
-
25
-
26
-
27
-
28
-
29
-
30
-
31
-
32
-
33
-
34
-
35
-
36
-
37
-
38
-
39
-
40
-
41
-
42
-
43
-
44
-
45
-
46
-
47
-
48
-
49
-
50
-
51
-
52
-
53
-
54
-
55
-
56
-
57
-
58
-
59
-
60
-
61
-
62
-
63
-
64
-
65
-
66
-
67
-
68
-
69
-
70
-
71
-
72
-
73
-
74
-
75
-
76
-
77
-
78
-
79
-
80
-
81
-
82
-
83
-
84
-
85
-
86
-
87
-
88
-
89
-
90
-
91
-
92
-
93
-
94
-
95
-
96
-
97
-
98
-
99
-
100
-
101
-
102
-
103
-
104
-
105
-
106
-
107
-
108
-
109
-
110
-
111
-
112
-
113
-
114
-
115
-
116
-
 117
117 -
 118
118 -
 119
119 -
 120
120 -
 121
121 -
 122
122 -
 123
123 -
 124
124 -
 125
125 -
 126
126 -
 127
127 -
 128
128 -
 129
129 -
 130
130 -
 131
131 -
 132
132 -
 133
133 -
 134
134 -
 135
135 -
 136
136 -
 137
137 -
138
-
139
-
140
-
141
-
142
-
143
-
144
-
145
-
146
-
147
-
148
-
149
-
150
-
151
-
152
-
153
-
154
-
155
-
156
-
157
-
158
-
159
-
160
-
161
-
162
-
163
-
164
-
165
-
166
-
167
-
168
-
169
 |
 |

THE WESTERN UNION COMPANY
NOTES TO CONSOLIDATED FINANCIAL STATEMENTS—(Continued)
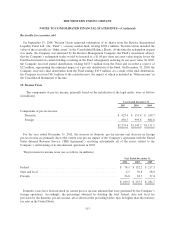
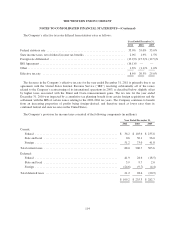
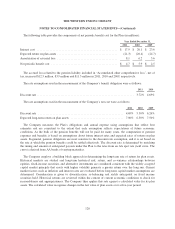
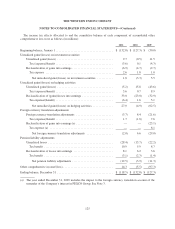
The following table provides the components of net periodic benefit cost for the Plan (in millions):
Year Ended December 31,
2011 2010 2009
Interest cost ....................................................... $ 17.9 $ 20.1 $ 23.6
Expected return on plan assets ......................................... (21.3) (20.4) (24.7)
Amortization of actuarial loss ......................................... 8.1 6.2 3.6
Net periodic benefit cost ............................................. $ 4.7 $ 5.9 $ 2.5
The accrued loss related to the pension liability included in “Accumulated other comprehensive loss”, net of
tax, increased $12.5 million, $3.9 million and $11.3 million in 2011, 2010 and 2009, respectively.
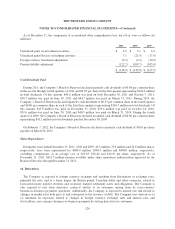
The rate assumptions used in the measurement of the Company’s benefit obligation were as follows:
2011 2010
Discount rate .................................................................. 3.72% 4.69%
The rate assumptions used in the measurement of the Company’s net cost were as follows:
2011 2010 2009
Discount rate .......................................................... 4.69% 5.30% 6.26%
Expected long-term return on plan assets .................................... 7.00% 6.50% 7.50%
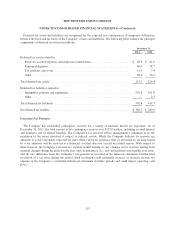
The Company measures the Plan’s obligations and annual expense using assumptions that reflect best
estimates and are consistent to the extent that each assumption reflects expectations of future economic
conditions. As the bulk of the pension benefits will not be paid for many years, the computation of pension
expenses and benefits is based on assumptions about future interest rates and expected rates of return on plan
assets. In general, pension obligations are most sensitive to the discount rate assumption, and it is set based on
the rate at which the pension benefits could be settled effectively. The discount rate is determined by matching
the timing and amount of anticipated payouts under the Plan to the rates from an AA spot rate yield curve. The
curve is derived from AA bonds of varying maturities.
The Company employs a building block approach in determining the long-term rate of return for plan assets.
Historical markets are studied and long-term historical risk, return, and co-variance relationships between
equities, fixed-income securities, and alternative investments are considered consistent with the widely accepted
capital market principle that assets with higher volatility generate a greater return over the long run. Current
market factors such as inflation and interest rates are evaluated before long-term capital market assumptions are
determined. Consideration is given to diversification, re-balancing and yields anticipated on fixed income
securities held. Historical returns are reviewed within the context of current economic conditions to check for
reasonableness and appropriateness. The Company then applies this rate against a calculated value for its plan
assets. The calculated value recognizes changes in the fair value of plan assets over a five-year period.
120