Western Union 2011 Annual Report Download - page 62
Download and view the complete annual report
Please find page 62 of the 2011 Western Union annual report below. You can navigate through the pages in the report by either clicking on the pages listed below, or by using the keyword search tool below to find specific information within the annual report.-
 1
1 -
2
-
3
-
4
-
5
-
6
-
7
-
8
-
9
-
10
-
11
-
12
-
13
-
14
-
15
-
16
-
17
-
18
-
19
-
20
-
21
-
22
-
23
-
24
-
25
-
26
-
27
-
28
-
29
-
30
-
31
-
32
-
33
-
34
-
35
-
36
-
37
-
38
-
39
-
40
-
41
-
42
-
43
-
44
-
45
-
46
-
47
-
48
-
49
-
50
-
51
-
 52
52 -
 53
53 -
 54
54 -
 55
55 -
 56
56 -
 57
57 -
 58
58 -
 59
59 -
 60
60 -
 61
61 -
 62
62 -
 63
63 -
 64
64 -
 65
65 -
 66
66 -
 67
67 -
 68
68 -
 69
69 -
 70
70 -
 71
71 -
 72
72 -
73
-
74
-
75
-
76
-
77
-
78
-
79
-
80
-
81
-
82
-
83
-
84
-
85
-
86
-
87
-
88
-
89
-
90
-
91
-
92
-
93
-
94
-
95
-
96
-
97
-
98
-
99
-
100
-
101
-
102
-
103
-
104
-
105
-
106
-
107
-
108
-
109
-
110
-
111
-
112
-
113
-
114
-
115
-
116
-
117
-
118
-
119
-
120
-
121
-
122
-
123
-
124
-
125
-
126
-
127
-
128
-
129
-
130
-
131
-
132
-
133
-
134
-
135
-
136
-
137
-
138
-
139
-
140
-
141
-
142
-
143
-
144
-
145
-
146
-
147
-
148
-
149
-
150
-
151
-
152
-
153
-
154
-
155
-
156
-
157
-
158
-
159
-
160
-
161
-
162
-
163
-
164
-
165
-
166
-
167
-
168
-
169
 |
 |
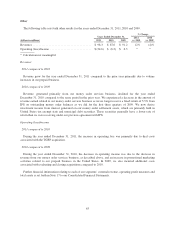
Selling, general and administrative
Selling, general and administrative expenses (“SG&A”) increased for the year ended December 31, 2011
compared to the same period in 2010 primarily due to increased expenses resulting from the acquisitions of
TGBP, Finint and Costa, including deal and integration costs associated with these acquisitions, investments in
strategic initiatives, and the weakening of the United States dollar compared to most other foreign currencies,
which resulted in a negative impact on the translation of our expenses, partially offset by restructuring savings.
SG&A decreased for the year ended December 31, 2010 compared to the same period in the prior year due to
the settlement accrual that was recorded in 2009, as described below, lower marketing-related expenditures and
operating efficiencies, offset by incremental costs associated with Custom House and our retail expansion in
Europe pursuant to the Payment Services Directive, restructuring and related expenses of $44.5 million and
higher employee compensation costs.
During the year ended December 31, 2009, we recorded an accrual of $71.0 million for an agreement and
settlement with the State of Arizona and other states. On February 11, 2010, we signed this agreement and
settlement, which resolved all outstanding legal issues and claims with the State of Arizona and required us to
fund a multi-state not-for-profit organization promoting safety and security along the United States and Mexico
border, in which California, Texas and New Mexico are participating with Arizona. The accrual included
amounts for reimbursement to the State of Arizona for its costs associated with this matter. In addition, as part of
the agreement and settlement, we have made and expect to make certain investments in our compliance programs
along the United States and Mexico border and a monitor has been engaged for those programs. The costs of the
investments in our programs and for the monitor are expected to reach up to $23 million over the period from
signing to 2013.
During the years ended December 31, 2011, 2010 and 2009, marketing-related expenditures, principally
classified within SG&A, were approximately 4.1%, 4.1%, and 4.7%, respectively, of revenue. Marketing-related
expenditures include advertising, events, loyalty programs and the cost of employees dedicated to marketing
activities. When making decisions with respect to marketing investments, we review opportunities for advertising
and other marketing-related expenditures together with opportunities for fee adjustments, as discussed in
“Segment Discussion,” for consumer-to-consumer revenues and other initiatives in order to best maximize the
return on these investments.
Total other expense, net
Total other expense, net decreased during the year ended December 31, 2011 compared to the same period in
2010 due to the gains of $20.5 million and $29.4 million in connection with the remeasurement of our former
equity interests in Finint and Costa, respectively, to fair value. Additionally, during the year ended December 31,
2011, we recognized a $20.8 million net gain on foreign currency forward contracts with maturities of less than
one year entered into in order to reduce the economic variability related to the cash amounts used to fund
acquisitions of businesses with purchase prices denominated in foreign currencies, primarily for the TGBP
acquisition. These amounts were partially offset by increased interest expense in 2011 due to our debt issuances.
Total other expense, net increased during the year ended December 31, 2010 compared to 2009 primarily due
to an increase in interest expense resulting from our $250 million note issuance and financing costs incurred in
connection with our note exchange, and a decrease in interest income due to lower short-term interest rates and
the repayment of a note receivable due from an agent. These amounts were partially offset by the recovery of
$6.3 million of the $12 million reserve recorded in the prior year against our receivable from the Reserve
International Liquidity Fund due to the final settlement.
55