Western Union 2011 Annual Report Download - page 68
Download and view the complete annual report
Please find page 68 of the 2011 Western Union annual report below. You can navigate through the pages in the report by either clicking on the pages listed below, or by using the keyword search tool below to find specific information within the annual report.-
 1
1 -
2
-
3
-
4
-
5
-
6
-
7
-
8
-
9
-
10
-
11
-
12
-
13
-
14
-
15
-
16
-
17
-
18
-
19
-
20
-
21
-
22
-
23
-
24
-
25
-
26
-
27
-
28
-
29
-
30
-
31
-
32
-
33
-
34
-
35
-
36
-
37
-
38
-
39
-
40
-
41
-
42
-
43
-
44
-
45
-
46
-
47
-
48
-
49
-
50
-
51
-
52
-
53
-
54
-
55
-
56
-
57
-
 58
58 -
 59
59 -
 60
60 -
 61
61 -
 62
62 -
 63
63 -
 64
64 -
 65
65 -
 66
66 -
 67
67 -
 68
68 -
 69
69 -
 70
70 -
 71
71 -
 72
72 -
 73
73 -
 74
74 -
 75
75 -
 76
76 -
 77
77 -
 78
78 -
79
-
80
-
81
-
82
-
83
-
84
-
85
-
86
-
87
-
88
-
89
-
90
-
91
-
92
-
93
-
94
-
95
-
96
-
97
-
98
-
99
-
100
-
101
-
102
-
103
-
104
-
105
-
106
-
107
-
108
-
109
-
110
-
111
-
112
-
113
-
114
-
115
-
116
-
117
-
118
-
119
-
120
-
121
-
122
-
123
-
124
-
125
-
126
-
127
-
128
-
129
-
130
-
131
-
132
-
133
-
134
-
135
-
136
-
137
-
138
-
139
-
140
-
141
-
142
-
143
-
144
-
145
-
146
-
147
-
148
-
149
-
150
-
151
-
152
-
153
-
154
-
155
-
156
-
157
-
158
-
159
-
160
-
161
-
162
-
163
-
164
-
165
-
166
-
167
-
168
-
169
 |
 |

APAC revenue increased 13% for the year ended December 31, 2010 compared to the prior year due to
transaction growth of 14%. China’s revenue increased 10% on transaction growth of 7% for the year ended
December 31, 2010.
Foreign exchange revenues for the year ended December 31, 2010 grew compared to the prior year, driven
primarily by revenue from our international consumer-to-consumer business outside of the United States.
Fluctuations in the exchange rate between the United States dollar and currencies other than the United States
dollar have resulted in a reduction to transaction fees and foreign exchange revenues for the year ended
December 31, 2010 of $32.3 million over the same period in the previous year, net of foreign currency hedges,
that would not have occurred had there been constant currency rates. The largest impact was related to the
EMEASA region.
Operating income
2011 compared to 2010
Consumer-to-consumer operating income increased 6% during the year ended December 31, 2011 compared
to the same period in 2010 due to revenue growth. The change in operating income margin for the year ended
December 31, 2011 compared to the same period in 2010 was primarily due to restructuring savings and revenue
leverage, partially offset by negative currency impacts, including the effect of foreign currency hedges, and
spending on initiatives.
2010 compared to 2009
Consumer-to-consumer operating income increased 6% during the year ended December 31, 2010 compared to
the same period in 2009 due to lower marketing expenses and operating efficiencies, primarily decreased bad debt
expense, offset by higher employee compensation costs and incremental costs associated with our retail expansion
in Europe pursuant to the Payment Services Directive. The increase in operating income margin for the year ended
December 31, 2010 compared to the same period in the prior year resulted from these same factors.
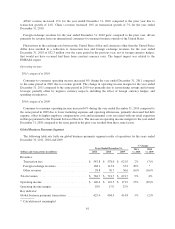
Global Business Payments Segment
The following table sets forth our global business payments segment results of operations for the years ended
December 31, 2011, 2010 and 2009.
Years Ended December 31,
% Change
2011
vs. 2010
2010
vs. 2009(dollars and transactions in millions) 2011 2010 2009
Revenues:
Transaction fees ............................. $ 587.8 $ 578.0 $ 621.9 2% (7)%
Foreign exchange revenues .................... 168.1 113.0 33.2 49% *
Other revenues .............................. 28.8 30.7 36.6 (6)% (16)%
Total revenues ................................ $ 784.7 $ 721.7 $ 691.7 9% 4%
Operating income .............................. $ 140.4 $ 122.5 $ 171.9 15% (29)%
Operating income margin ........................ 18% 17% 25%
Key indicator:
Global business payments transactions ............. 425.0 404.9 414.8 5% (2)%
* Calculation not meaningful
61