Western Union 2011 Annual Report Download - page 66
Download and view the complete annual report
Please find page 66 of the 2011 Western Union annual report below. You can navigate through the pages in the report by either clicking on the pages listed below, or by using the keyword search tool below to find specific information within the annual report.-
 1
1 -
2
-
3
-
4
-
5
-
6
-
7
-
8
-
9
-
10
-
11
-
12
-
13
-
14
-
15
-
16
-
17
-
18
-
19
-
20
-
21
-
22
-
23
-
24
-
25
-
26
-
27
-
28
-
29
-
30
-
31
-
32
-
33
-
34
-
35
-
36
-
37
-
38
-
39
-
40
-
41
-
42
-
43
-
44
-
45
-
46
-
47
-
48
-
49
-
50
-
51
-
52
-
53
-
54
-
55
-
 56
56 -
 57
57 -
 58
58 -
 59
59 -
 60
60 -
 61
61 -
 62
62 -
 63
63 -
 64
64 -
 65
65 -
 66
66 -
 67
67 -
 68
68 -
 69
69 -
 70
70 -
 71
71 -
 72
72 -
 73
73 -
 74
74 -
 75
75 -
 76
76 -
77
-
78
-
79
-
80
-
81
-
82
-
83
-
84
-
85
-
86
-
87
-
88
-
89
-
90
-
91
-
92
-
93
-
94
-
95
-
96
-
97
-
98
-
99
-
100
-
101
-
102
-
103
-
104
-
105
-
106
-
107
-
108
-
109
-
110
-
111
-
112
-
113
-
114
-
115
-
116
-
117
-
118
-
119
-
120
-
121
-
122
-
123
-
124
-
125
-
126
-
127
-
128
-
129
-
130
-
131
-
132
-
133
-
134
-
135
-
136
-
137
-
138
-
139
-
140
-
141
-
142
-
143
-
144
-
145
-
146
-
147
-
148
-
149
-
150
-
151
-
152
-
153
-
154
-
155
-
156
-
157
-
158
-
159
-
160
-
161
-
162
-
163
-
164
-
165
-
166
-
167
-
168
-
169
 |
 |
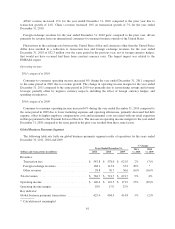
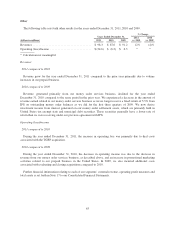
Transaction fees and foreign exchange revenues
2011 compared to 2010
For the year ended December 31, 2011 compared to the same period in 2010, consumer-to-consumer money
transfer revenue grew 5%, on transaction growth of 6%. The weakening of the United States dollar compared to
most other foreign currencies positively impacted our revenue growth by approximately 1%, which was offset by
slight price reductions for the year ended December 31, 2011.
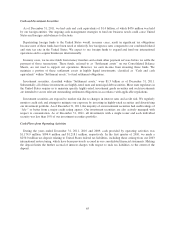
Revenue in our EMEASA region increased 4% during the year ended December 31, 2011 compared to the
same period in 2010 due to transaction growth of 4% as well as the other factors described above. The United
Kingdom, France, Germany, and the Gulf States continued to experience revenue and transaction growth for the
year ended December 31, 2011 versus the prior year, which was partially offset by softness in Southern Europe
and Russia and declines resulting from the political unrest in Libya and the Ivory Coast. Our money transfer
business to India experienced revenue growth of 11% and transaction growth of 10% for the year ended
December 31, 2011 versus the prior year.
Americas revenue increased 5% due to transaction growth of 6% for the year ended December 31, 2011
compared to the same period in 2010. Our domestic business experienced revenue growth of 8% for the year
ended December 31, 2011 due to transaction growth of 16%. Transaction growth in our domestic business was
higher than revenue growth due to transaction growth being greater in lower principal bands, which have lower
revenue per transaction. Our United States outbound business experienced both transaction and revenue growth
in the year ended December 31, 2011. Mexico revenue increased 2% on flat transactions for the year ended
December 31, 2011. Our Mexico business is being affected by on-going changes to our compliance procedures
related to the agreement and settlement with the State of Arizona and other states. These changes are expected to
cause our Mexico business to decline in 2012.
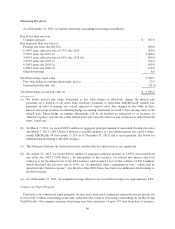
Revenue in our Asia Pacific (“APAC”) region increased 11% for the year ended December 31, 2011 compared
to the same period in 2010 due to transaction growth of 9% and the weakening of the United States dollar
compared to most other foreign currencies, which positively impacted revenue. China’s revenue increased 6% for
year ended December 31, 2011 on transaction growth of 4% for the year ended December 31, 2011.
Foreign exchange revenues for the year ended December 31, 2011 grew compared to the same period in 2010,
driven primarily by increased amounts of cross-border principal sent.
Fluctuations in the exchange rate between the United States dollar and currencies other than the United States
dollar have resulted in a benefit to transaction fees and foreign exchange revenues for the year ended
December 31, 2011 of $39.1 million over the same period in 2010, net of foreign currency hedges, that would not
have occurred had there been constant currency rates. The largest benefit was related to the EMEASA region.
We have historically implemented and will likely implement future strategic fee reductions and actions to
adjust foreign exchange spreads, where appropriate, taking into account a variety of factors. Fee and foreign
exchange reductions generally reduce revenues in the near term, but are done in anticipation that they will result
in increased transaction volumes and increased revenues over time. In certain corridors, we may also implement
fee or foreign exchange spread increases. In 2011, we adjusted our reporting of the net impact of price
reductions. We now calculate the impact of price reductions against prior year transaction volumes, rather than
current year transaction volumes. We believe utilizing prior year transaction volumes more appropriately
differentiates between the impacts of price reductions versus other items impacting revenue. Under the new
methodology, the fee decreases and foreign exchange actions were approximately 1% of total Western Union
revenue for the full year 2011 compared to approximately 3% for the full year 2010, as fee reductions were
slightly lower and there is some offset by modest increases in foreign currency spreads in some corridors. Under
the previous methodology, we reported that the impact of price reductions in 2010 was 4%.
59