Western Union 2011 Annual Report Download - page 70
Download and view the complete annual report
Please find page 70 of the 2011 Western Union annual report below. You can navigate through the pages in the report by either clicking on the pages listed below, or by using the keyword search tool below to find specific information within the annual report.-
 1
1 -
2
-
3
-
4
-
5
-
6
-
7
-
8
-
9
-
10
-
11
-
12
-
13
-
14
-
15
-
16
-
17
-
18
-
19
-
20
-
21
-
22
-
23
-
24
-
25
-
26
-
27
-
28
-
29
-
30
-
31
-
32
-
33
-
34
-
35
-
36
-
37
-
38
-
39
-
40
-
41
-
42
-
43
-
44
-
45
-
46
-
47
-
48
-
49
-
50
-
51
-
52
-
53
-
54
-
55
-
56
-
57
-
58
-
59
-
 60
60 -
 61
61 -
 62
62 -
 63
63 -
 64
64 -
 65
65 -
 66
66 -
 67
67 -
 68
68 -
 69
69 -
 70
70 -
 71
71 -
 72
72 -
 73
73 -
 74
74 -
 75
75 -
 76
76 -
 77
77 -
 78
78 -
 79
79 -
 80
80 -
81
-
82
-
83
-
84
-
85
-
86
-
87
-
88
-
89
-
90
-
91
-
92
-
93
-
94
-
95
-
96
-
97
-
98
-
99
-
100
-
101
-
102
-
103
-
104
-
105
-
106
-
107
-
108
-
109
-
110
-
111
-
112
-
113
-
114
-
115
-
116
-
117
-
118
-
119
-
120
-
121
-
122
-
123
-
124
-
125
-
126
-
127
-
128
-
129
-
130
-
131
-
132
-
133
-
134
-
135
-
136
-
137
-
138
-
139
-
140
-
141
-
142
-
143
-
144
-
145
-
146
-
147
-
148
-
149
-
150
-
151
-
152
-
153
-
154
-
155
-
156
-
157
-
158
-
159
-
160
-
161
-
162
-
163
-
164
-
165
-
166
-
167
-
168
-
169
 |
 |

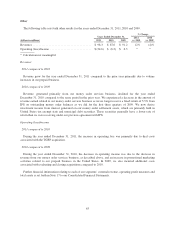
Other
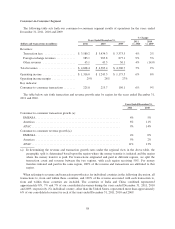
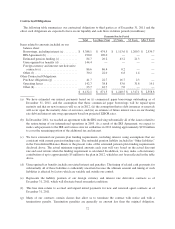
The following table sets forth other results for the years ended December 31, 2011, 2010 and 2009.
Years Ended December 31,
% Change
2011
vs. 2010
2010
vs. 2009(dollars in millions) 2011 2010 2009
Revenues ........................................ $ 98.3 $ 87.6 $ 91.2 12% (4)%
Operating (loss)/income ............................ $(24.6) $ (6.2) $ 6.3 * *
* Calculation not meaningful
Revenues
2011 compared to 2010
Revenue grew for the year ended December 31, 2011 compared to the prior year primarily due to volume
increases in our prepaid business.
2010 compared to 2009
Revenue, generated primarily from our money order services business, declined for the year ended
December 31, 2010 compared to the same period in the prior year. We experienced a decrease in the amount of
revenue earned related to our money order services business as we no longer receive a fixed return of 5.5% from
IPS on outstanding money order balances as we did for the first three quarters of 2009. We now derive
investment income from interest generated on our money order settlement assets, which are primarily held in
United States tax exempt state and municipal debt securities. These securities generally have a lower rate of
return than we were receiving under our previous agreement with IPS.
Operating (loss)/income
2011 compared to 2010
During the year ended December 31, 2011, the increase in operating loss was primarily due to deal costs
associated with the TGBP acquisition.
2010 compared to 2009
During the year ended December 31, 2010, the decrease in operating income was due to the decrease in
revenue from our money order services business, as described above, and an increase in promotional marketing
activities related to our prepaid business in the United States. In 2009, we also incurred additional costs
associated with evaluating and closing acquisitions compared to 2010.
Further financial information relating to each of our segments’ external revenue, operating profit measures and
total assets is set forth in Note 17 to our Consolidated Financial Statements.
63