United Airlines 2015 Annual Report Download - page 90
Download and view the complete annual report
Please find page 90 of the 2015 United Airlines annual report below. You can navigate through the pages in the report by either clicking on the pages listed below, or by using the keyword search tool below to find specific information within the annual report.-
 1
1 -
2
-
3
-
4
-
5
-
6
-
7
-
8
-
9
-
10
-
11
-
12
-
13
-
14
-
15
-
16
-
17
-
18
-
19
-
20
-
21
-
22
-
23
-
24
-
25
-
26
-
27
-
28
-
29
-
30
-
31
-
32
-
33
-
34
-
35
-
36
-
37
-
38
-
39
-
40
-
41
-
42
-
43
-
44
-
45
-
46
-
47
-
48
-
49
-
50
-
51
-
52
-
53
-
54
-
55
-
56
-
57
-
58
-
59
-
60
-
61
-
62
-
63
-
64
-
65
-
66
-
67
-
68
-
69
-
70
-
71
-
72
-
73
-
74
-
75
-
76
-
77
-
78
-
79
-
 80
80 -
 81
81 -
 82
82 -
 83
83 -
 84
84 -
 85
85 -
 86
86 -
 87
87 -
 88
88 -
 89
89 -
 90
90 -
 91
91 -
 92
92 -
 93
93 -
 94
94 -
 95
95 -
 96
96 -
 97
97 -
 98
98 -
 99
99 -
 100
100 -
101
-
102
-
103
-
104
-
105
-
106
-
107
-
108
-
109
-
110
-
111
-
112
-
113
-
114
-
115
-
116
-
117
-
118
-
119
-
120
-
121
-
122
-
123
-
124
-
125
-
126
-
127
-
128
-
129
-
130
-
131
-
132
-
133
-
134
-
135
-
136
-
137
-
138
-
139
-
140
-
141
-
142
-
143
-
144
-
145
-
146
-
147
-
148
-
149
-
150
-
151
-
152
-
153
-
154
-
155
-
156
-
157
-
158
-
159
-
160
-
161
-
162
-
163
-
164
-
165
-
166
-
167
-
168
-
169
-
170
-
171
-
172
-
173
-
174
 |
 |

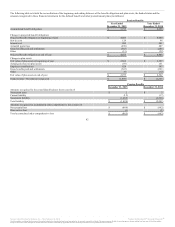
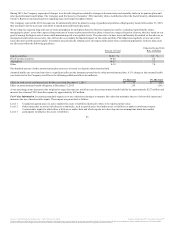
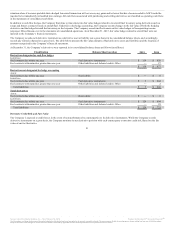
United’s debt-related derivatives presented in the tables above related to (a) supplemental indentures that provided that United’s convertible debt was
convertible into shares of UAL common stock upon the terms and conditions specified in the indentures, and (b) the embedded conversion options in
United’s convertible debt that were required to be separated and accounted for as though they were free-standing derivatives as a result of the United debt
becoming convertible into the common stock of a different reporting entity. The derivatives described above related to the 4.5% Convertible Notes due 2015
(the “4.5% Convertible Notes”). Gains (losses) on these derivatives were recorded in Nonoperating income (expense): Miscellaneous, net in United’s
statements of consolidated operations. These derivatives along with their gains (losses) were reported in United’s separate financial statements and were
eliminated in consolidation for UAL. In January 2015, the holders of substantially all of the remaining $202 million principal amount of the 4.5%
Convertible Notes exercised their conversion option resulting in the issuance of 11 million shares of UAL common stock. The derivative assets and liabilities
associated with the 4.5% Convertible Notes were settled in connection with the retirement of the related convertible debt, and the final accounting did not
materially impact UAL’s or United’s statements of consolidated operations.
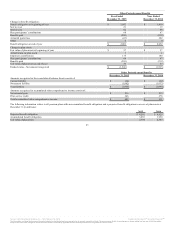
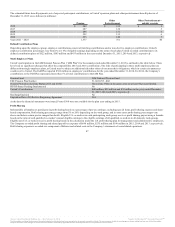
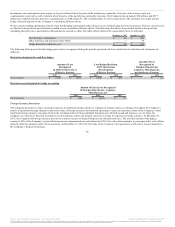
—The short-term investments shown in the table above are classified as available-for-sale. As of December 31,
2015, asset-backed securities have remaining maturities of less than one year to approximately 34 years, corporate debt securities have remaining maturities
of less than one year to approximately six years and CDARS have maturities of less than one year. U.S. government and other securities have maturities of
less than one year to approximately three years. The EETC securities mature in 2019.
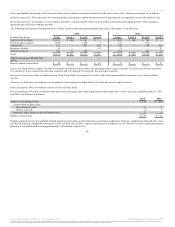
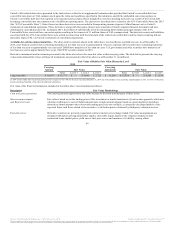
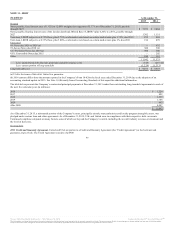
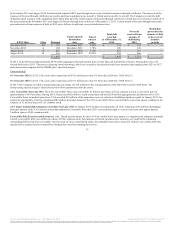
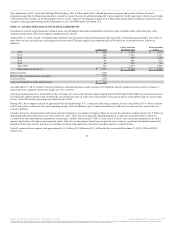
Derivative instruments and investments presented in the tables above have the same fair value as their carrying value. The table below presents the carrying
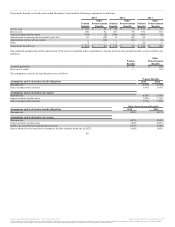
values and estimated fair values of financial instruments not presented in the tables above as of December 31 (in millions):
Total Level 1 Level 2 Level 3 Total Level 1 Level 2 Level 3
Long-term debt $ 10,897 $ 11,371 $ — $ 8,646 $ 2,725 $ 11,266 $ 12,386 $ — $ 8,568 $ 3,818
(a) 2014 amount differs from the amount reported in the Company’s Form 10-K for the fiscal year ended December 31, 2014 due to the adoption of an accounting standard update in 2015. See Note 1(t) Recently
Issued Accounting Standards of this report for additional information.
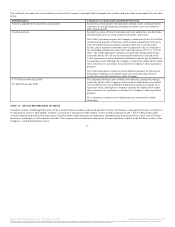
Fair value of the financial instruments included in the tables above was determined as follows:
The carrying amounts approximate fair value because of the short-term maturity of these assets.
Fair value is based on (a) the trading prices of the investment or similar instruments, (b) an income approach, which uses
valuation techniques to convert future amounts into a single present amount based on current market expectations
about those future amounts when observable trading prices are not available, (c) internally-developed models of the
expected future cash flows related to the securities, or (d) broker quotes obtained by third-party valuation services.
Derivative contracts are privately negotiated contracts and are not exchange traded. Fair value measurements are
estimated with option pricing models that employ observable inputs. Inputs to the valuation models include
contractual terms, market prices, yield curves, fuel price curves and measures of volatility, among others.
89
Source: United Continental Holdings, Inc., 10-K, February 18, 2016 Powered by Morningstar® Document Research℠
The information contained herein may not be copied, adapted or distributed and is not warranted to be accurate, complete or timely. The user assumes all risks for any damages or losses arising from any use of this information,
except to the extent such damages or losses cannot be limited or excluded by applicable law. Past financial performance is no guarantee of future results.