United Airlines 2015 Annual Report Download - page 87
Download and view the complete annual report
Please find page 87 of the 2015 United Airlines annual report below. You can navigate through the pages in the report by either clicking on the pages listed below, or by using the keyword search tool below to find specific information within the annual report.-
 1
1 -
2
-
3
-
4
-
5
-
6
-
7
-
8
-
9
-
10
-
11
-
12
-
13
-
14
-
15
-
16
-
17
-
18
-
19
-
20
-
21
-
22
-
23
-
24
-
25
-
26
-
27
-
28
-
29
-
30
-
31
-
32
-
33
-
34
-
35
-
36
-
37
-
38
-
39
-
40
-
41
-
42
-
43
-
44
-
45
-
46
-
47
-
48
-
49
-
50
-
51
-
52
-
53
-
54
-
55
-
56
-
57
-
58
-
59
-
60
-
61
-
62
-
63
-
64
-
65
-
66
-
67
-
68
-
69
-
70
-
71
-
72
-
73
-
74
-
75
-
76
-
 77
77 -
 78
78 -
 79
79 -
 80
80 -
 81
81 -
 82
82 -
 83
83 -
 84
84 -
 85
85 -
 86
86 -
 87
87 -
 88
88 -
 89
89 -
 90
90 -
 91
91 -
 92
92 -
 93
93 -
 94
94 -
 95
95 -
 96
96 -
 97
97 -
98
-
99
-
100
-
101
-
102
-
103
-
104
-
105
-
106
-
107
-
108
-
109
-
110
-
111
-
112
-
113
-
114
-
115
-
116
-
117
-
118
-
119
-
120
-
121
-
122
-
123
-
124
-
125
-
126
-
127
-
128
-
129
-
130
-
131
-
132
-
133
-
134
-
135
-
136
-
137
-
138
-
139
-
140
-
141
-
142
-
143
-
144
-
145
-
146
-
147
-
148
-
149
-
150
-
151
-
152
-
153
-
154
-
155
-
156
-
157
-
158
-
159
-
160
-
161
-
162
-
163
-
164
-
165
-
166
-
167
-
168
-
169
-
170
-
171
-
172
-
173
-
174
 |
 |

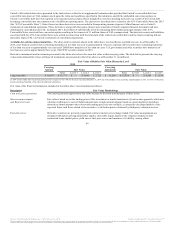
Assets and liabilities measured at fair value are based on the valuation techniques identified in the tables below. The valuation techniques are as follows:
(a) Prices and other relevant information generated by market transactions involving identical or comparable assets and liabilities; and
(b) Techniques to convert future amounts to a single current value based on market expectations (including present value techniques,
option-pricing and excess earnings models).
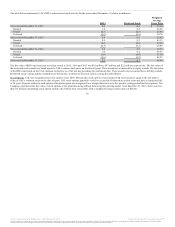
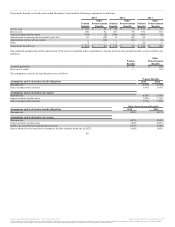
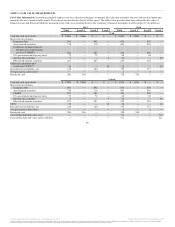
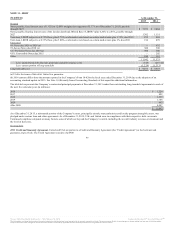
The following tables present information about United’s pension and other postretirement plan assets at December 31 (in millions):
Pension Plan Assets:
Equity securities funds $1,135 $ 254 $ 881 $ — $ 1,181 $ 388 $ 793 $ —
Fixed-income securities 1,109 — 1,100 9 813 — 813 —
Alternatives 527 — 267 260 359 — 148 211
Insurance contract 18 — — 18 21 — — 21
Other investments 186 37 149 — 188 — 165 23
Total $2,975 $ 291 $2,397 $ 287 $ 2,562 $ 388 $1,919 $ 255
Other Postretirement Benefit Plan
Assets:
Deposit administration fund $ 56 $ — $ — $ 56 $ 57 $ — $ — $ 57
Equities include investments in both developed market and emerging market equity securities. Fixed-income includes primarily
U.S. and non-U.S. government fixed-income securities and U.S. and non-U.S corporate fixed-income securities.
Each of these investments are stable value investment products structured to provide investment
income.
Alternative investments consist primarily of investments in hedge funds, real estate and private equity interests.
Other investments consist of cash and other funds.
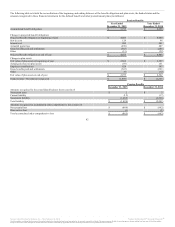
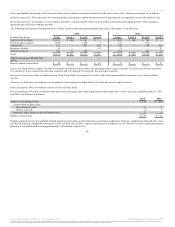
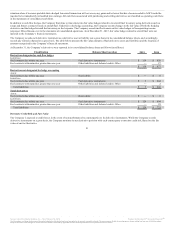
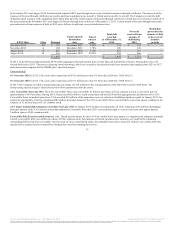
The reconciliation of United’s defined benefit plan assets measured at fair value using unobservable inputs (Level 3) for the years ended December 31, 2015
and 2014 is as follows (in millions):
Balance at beginning of year $ 312 $ 293
Actual return on plan assets:
Sold during the year 11 7
Held at year end (1) 6
Purchases, sales, issuances and settlements (net) 21 6
Balance at end of year $ 343 $ 312
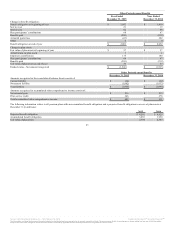
Funding requirements for tax-qualified defined benefit pension plans are determined by government regulations. United’s contributions reflected above have
satisfied its required contributions through the 2015 calendar year. In 2016, employer anticipated contributions to all of United’s pension and postretirement
plans are at least $400 million and approximately $120 million, respectively.
86
Source: United Continental Holdings, Inc., 10-K, February 18, 2016 Powered by Morningstar® Document Research℠
The information contained herein may not be copied, adapted or distributed and is not warranted to be accurate, complete or timely. The user assumes all risks for any damages or losses arising from any use of this information,
except to the extent such damages or losses cannot be limited or excluded by applicable law. Past financial performance is no guarantee of future results.