United Airlines 2015 Annual Report Download - page 86
Download and view the complete annual report
Please find page 86 of the 2015 United Airlines annual report below. You can navigate through the pages in the report by either clicking on the pages listed below, or by using the keyword search tool below to find specific information within the annual report.-
 1
1 -
2
-
3
-
4
-
5
-
6
-
7
-
8
-
9
-
10
-
11
-
12
-
13
-
14
-
15
-
16
-
17
-
18
-
19
-
20
-
21
-
22
-
23
-
24
-
25
-
26
-
27
-
28
-
29
-
30
-
31
-
32
-
33
-
34
-
35
-
36
-
37
-
38
-
39
-
40
-
41
-
42
-
43
-
44
-
45
-
46
-
47
-
48
-
49
-
50
-
51
-
52
-
53
-
54
-
55
-
56
-
57
-
58
-
59
-
60
-
61
-
62
-
63
-
64
-
65
-
66
-
67
-
68
-
69
-
70
-
71
-
72
-
73
-
74
-
75
-
 76
76 -
 77
77 -
 78
78 -
 79
79 -
 80
80 -
 81
81 -
 82
82 -
 83
83 -
 84
84 -
 85
85 -
 86
86 -
 87
87 -
 88
88 -
 89
89 -
 90
90 -
 91
91 -
 92
92 -
 93
93 -
 94
94 -
 95
95 -
 96
96 -
97
-
98
-
99
-
100
-
101
-
102
-
103
-
104
-
105
-
106
-
107
-
108
-
109
-
110
-
111
-
112
-
113
-
114
-
115
-
116
-
117
-
118
-
119
-
120
-
121
-
122
-
123
-
124
-
125
-
126
-
127
-
128
-
129
-
130
-
131
-
132
-
133
-
134
-
135
-
136
-
137
-
138
-
139
-
140
-
141
-
142
-
143
-
144
-
145
-
146
-
147
-
148
-
149
-
150
-
151
-
152
-
153
-
154
-
155
-
156
-
157
-
158
-
159
-
160
-
161
-
162
-
163
-
164
-
165
-
166
-
167
-
168
-
169
-
170
-
171
-
172
-
173
-
174
 |
 |

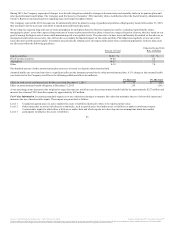
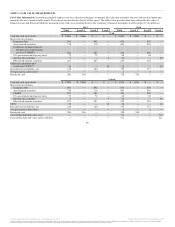
During 2015, the Company experienced changes in its benefit obligations related to changes in discount rates and mortality tables in its pension plans and
other postretirement benefit plans. The Company used the Society of Actuaries’ 2014 mortality tables, modified to reflect the Social Security Administration
Trustee’s Report on current projections regarding expected longevity improvements.
The Company selected the 2015 discount rate for substantially all of its plans by using a hypothetical portfolio of high quality bonds at December 31, 2015,
that would provide the necessary cash flows to match projected benefit payments.
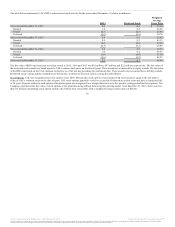
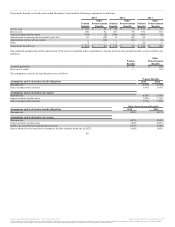
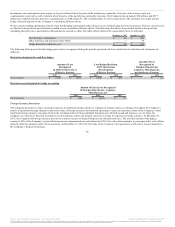
We develop our expected long-term rate of return assumption for such plans based on historical experience and by evaluating input from the trustee
managing the plans’ assets. Our expected long-term rate of return on plan assets for these plans is based on a target allocation of assets, which is based on our
goal of earning the highest rate of return while maintaining risk at acceptable levels. The plans strive to have assets sufficiently diversified so that adverse or
unexpected results from one security class will not have an unduly detrimental impact on the entire portfolio. Plan fiduciaries regularly review our actual
asset allocation and the pension plans’ investments are periodically rebalanced to our targeted allocation when considered appropriate. United’s plan assets
are allocated within the following guidelines:
Percent of Total
Expected Long-Term
Rate of Return
Equity securities 30-40 % 9.5 %
Fixed-income securities 34-44 5.0
Alternatives 14-27 7.3
Other 0-10 7.0
One-hundred percent of other postretirement plan assets are invested in a deposit administration fund.
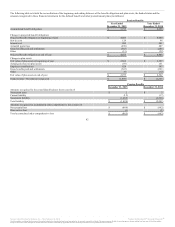
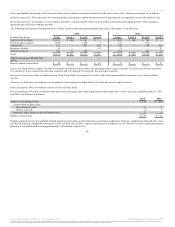
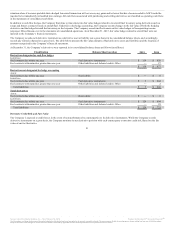
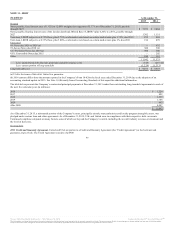
Assumed health care cost trend rates have a significant effect on the amounts reported for the other postretirement plans. A 1% change in the assumed health
care trend rate for the Company would have the following additional effects (in millions):
Effect on total service and interest cost for the year ended December 31, 2015 $ 13 $ (11)
Effect on postretirement benefit obligation at December 31, 2015 219 (191)
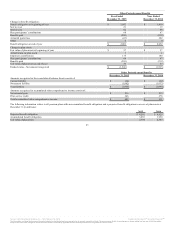
A one percentage point decrease in the weighted average discount rate would increase the postretirement benefit liability by approximately $227 million and
increase the estimated 2015 benefits expense by approximately $12 million.
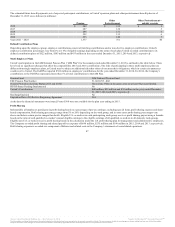
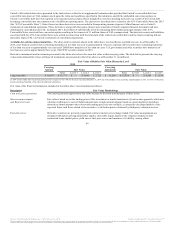
Fair Value Information. Accounting standards require us to use valuation techniques to measure fair value that maximize the use of observable inputs and
minimize the use of unobservable inputs. These inputs are prioritized as follows:
Level 1 Unadjusted quoted prices in active markets for assets or liabilities identical to those to be reported at fair value
Level 2 Other inputs that are observable directly or indirectly, such as quoted prices for similar assets or liabilities or market-corroborated inputs
Level 3
Unobservable inputs for which there is little or no market data and which require us to develop our own assumptions about how market
participants would price the assets or liabilities
85
Source: United Continental Holdings, Inc., 10-K, February 18, 2016 Powered by Morningstar® Document Research℠
The information contained herein may not be copied, adapted or distributed and is not warranted to be accurate, complete or timely. The user assumes all risks for any damages or losses arising from any use of this information,
except to the extent such damages or losses cannot be limited or excluded by applicable law. Past financial performance is no guarantee of future results.