United Airlines 2015 Annual Report Download - page 29
Download and view the complete annual report
Please find page 29 of the 2015 United Airlines annual report below. You can navigate through the pages in the report by either clicking on the pages listed below, or by using the keyword search tool below to find specific information within the annual report.
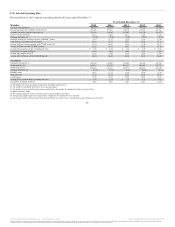
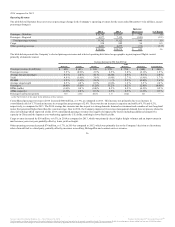
Presented below is the Company’s operating data for the years ended December 31.
Passengers (thousands) (a) 96,327 91,475 91,329 93,595 96,360
Revenue passenger miles (“RPMs”) (millions) (b) 183,642 179,015 178,578 179,416 181,763
Available seat miles (“ASMs”) (millions) (c) 219,989 214,105 213,007 216,330 219,437
Cargo ton miles (millions) 2,614 2,487 2,213 2,460 2,646
Passenger load factor (d) 83.5% 83.6% 83.8% 82.9% 82.8%
Passenger revenue per available seat mile (“PRASM”) (cents) 11.97 12.51 12.20 11.93 11.84
Total revenue per available seat mile (cents) 14.19 14.81 14.51 13.92 13.77
Average yield per revenue passenger mile (“Yield”) (cents) (e) 14.34 14.96 14.56 14.38 14.29
Cost per available seat mile (“CASM”) (cents) 12.42 14.03 14.31 14.12 13.15
Average price per gallon of fuel, including fuel taxes $ 1.96 $ 2.98 $ 3.12 $ 3.27 $ 3.01
Fuel gallons consumed (millions) 3,216 3,183 3,204 3,275 3,303
Average stage length (miles) (f) 1,922 1,958 1,934 1,895 1,844
Average daily utilization of each aircraft (hours) (g) 10:24 10:26 10:28 10:38 10:42
Passengers (thousands) (a) 140,369 138,029 139,209 140,441 141,799
RPMs (millions) (b) 208,611 205,559 205,167 205,485 207,531
ASMs (millions) (c) 250,003 246,021 245,354 248,860 252,528
Passenger load factor (d) 83.4% 83.6% 83.6% 82.6% 82.2%
PRASM (cents) 13.11 13.72 13.50 13.09 12.87
Yield (cents) (e) 15.72 16.42 16.14 15.86 15.67
CASM (cents) 13.08 14.85 15.09 14.91 13.97
Average price per gallon of fuel, including fuel taxes $ 1.94 $ 2.99 $ 3.13 $ 3.27 $ 3.06
Fuel gallons consumed (millions) 3,886 3,905 3,947 4,016 4,038
(a) The number of revenue passengers measured by each flight segment flown.
(b) The number of scheduled miles flown by revenue passengers.
(c) The number of seats available for passengers multiplied by the number of scheduled miles those seats are flown.
(d) RPM divided by ASM.
(e) The average passenger revenue received for each revenue passenger mile flown.
(f) Average stage length equals the average distance a flight travels weighted for size of aircraft.
(g) The average number of hours per day that an aircraft flown in revenue service is operated (from gate departure to gate arrival).
28
Source: United Continental Holdings, Inc., 10-K, February 18, 2016 Powered by Morningstar® Document Research℠
The information contained herein may not be copied, adapted or distributed and is not warranted to be accurate, complete or timely. The user assumes all risks for any damages or losses arising from any use of this information,
except to the extent such damages or losses cannot be limited or excluded by applicable law. Past financial performance is no guarantee of future results.


