United Airlines 2015 Annual Report Download - page 28
Download and view the complete annual report
Please find page 28 of the 2015 United Airlines annual report below. You can navigate through the pages in the report by either clicking on the pages listed below, or by using the keyword search tool below to find specific information within the annual report.-
 1
1 -
2
-
3
-
4
-
5
-
6
-
7
-
8
-
9
-
10
-
11
-
12
-
13
-
14
-
15
-
16
-
17
-
 18
18 -
 19
19 -
 20
20 -
 21
21 -
 22
22 -
 23
23 -
 24
24 -
 25
25 -
 26
26 -
 27
27 -
 28
28 -
 29
29 -
 30
30 -
 31
31 -
 32
32 -
 33
33 -
 34
34 -
 35
35 -
 36
36 -
 37
37 -
 38
38 -
39
-
40
-
41
-
42
-
43
-
44
-
45
-
46
-
47
-
48
-
49
-
50
-
51
-
52
-
53
-
54
-
55
-
56
-
57
-
58
-
59
-
60
-
61
-
62
-
63
-
64
-
65
-
66
-
67
-
68
-
69
-
70
-
71
-
72
-
73
-
74
-
75
-
76
-
77
-
78
-
79
-
80
-
81
-
82
-
83
-
84
-
85
-
86
-
87
-
88
-
89
-
90
-
91
-
92
-
93
-
94
-
95
-
96
-
97
-
98
-
99
-
100
-
101
-
102
-
103
-
104
-
105
-
106
-
107
-
108
-
109
-
110
-
111
-
112
-
113
-
114
-
115
-
116
-
117
-
118
-
119
-
120
-
121
-
122
-
123
-
124
-
125
-
126
-
127
-
128
-
129
-
130
-
131
-
132
-
133
-
134
-
135
-
136
-
137
-
138
-
139
-
140
-
141
-
142
-
143
-
144
-
145
-
146
-
147
-
148
-
149
-
150
-
151
-
152
-
153
-
154
-
155
-
156
-
157
-
158
-
159
-
160
-
161
-
162
-
163
-
164
-
165
-
166
-
167
-
168
-
169
-
170
-
171
-
172
-
173
-
174
 |
 |

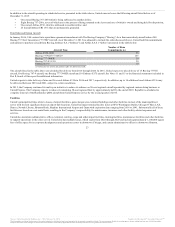
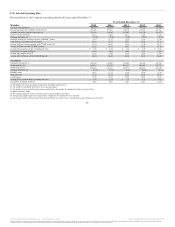
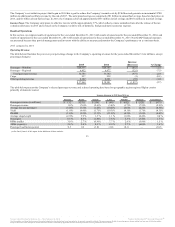
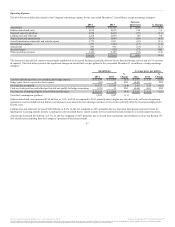
The Company’s consolidated financial statements and statistical data are provided in the tables below.
Operating revenue $ 37,864 $ 38,901 $ 38,279 $ 37,152 $ 37,110
Operating expense 32,698 36,528 37,030 37,113 35,288
Operating income 5,166 2,373 1,249 39 1,822
Net income (loss) 7,340 1,132 571 (723) 840
Basic earnings (loss) per share 19.52 3.05 1.64 (2.18) 2.55
Diluted earnings (loss) per share 19.47 2.93 1.53 (2.18) 2.26
Unrestricted cash, cash equivalents and short-term
investments $ 5,196 $ 4,384 $ 5,121 $ 6,543 $ 7,762
Total assets (a) 40,861 36,595 36,021 36,963 37,266
Debt and capital lease obligations (a) 11,759 11,947 12,293 13,043 12,629
(a) Amounts for years 2014, 2013, 2012 and 2011 differ from prior Form 10-K reports due to the adoption of an accounting standard update in 2015.
See Note 1(t) Recently Issued Accounting Standards to the financial statements included in Part II, Item 8 of this report for additional information.
27
Source: United Continental Holdings, Inc., 10-K, February 18, 2016 Powered by Morningstar® Document Research℠
The information contained herein may not be copied, adapted or distributed and is not warranted to be accurate, complete or timely. The user assumes all risks for any damages or losses arising from any use of this information,
except to the extent such damages or losses cannot be limited or excluded by applicable law. Past financial performance is no guarantee of future results.