United Airlines 2015 Annual Report Download - page 53
Download and view the complete annual report
Please find page 53 of the 2015 United Airlines annual report below. You can navigate through the pages in the report by either clicking on the pages listed below, or by using the keyword search tool below to find specific information within the annual report.-
 1
1 -
2
-
3
-
4
-
5
-
6
-
7
-
8
-
9
-
10
-
11
-
12
-
13
-
14
-
15
-
16
-
17
-
18
-
19
-
20
-
21
-
22
-
23
-
24
-
25
-
26
-
27
-
28
-
29
-
30
-
31
-
32
-
33
-
34
-
35
-
36
-
37
-
38
-
39
-
40
-
41
-
42
-
 43
43 -
 44
44 -
 45
45 -
 46
46 -
 47
47 -
 48
48 -
 49
49 -
 50
50 -
 51
51 -
 52
52 -
 53
53 -
 54
54 -
 55
55 -
 56
56 -
 57
57 -
 58
58 -
 59
59 -
 60
60 -
 61
61 -
 62
62 -
 63
63 -
64
-
65
-
66
-
67
-
68
-
69
-
70
-
71
-
72
-
73
-
74
-
75
-
76
-
77
-
78
-
79
-
80
-
81
-
82
-
83
-
84
-
85
-
86
-
87
-
88
-
89
-
90
-
91
-
92
-
93
-
94
-
95
-
96
-
97
-
98
-
99
-
100
-
101
-
102
-
103
-
104
-
105
-
106
-
107
-
108
-
109
-
110
-
111
-
112
-
113
-
114
-
115
-
116
-
117
-
118
-
119
-
120
-
121
-
122
-
123
-
124
-
125
-
126
-
127
-
128
-
129
-
130
-
131
-
132
-
133
-
134
-
135
-
136
-
137
-
138
-
139
-
140
-
141
-
142
-
143
-
144
-
145
-
146
-
147
-
148
-
149
-
150
-
151
-
152
-
153
-
154
-
155
-
156
-
157
-
158
-
159
-
160
-
161
-
162
-
163
-
164
-
165
-
166
-
167
-
168
-
169
-
170
-
171
-
172
-
173
-
174
 |
 |

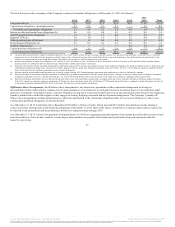
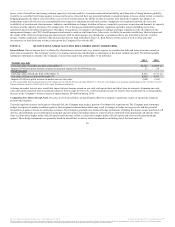
The fuel hedge portfolio is comprised of many individual hedge contracts (primarily option contracts) on multiple underlying commodities and entered into
at various points in time, resulting in a wide range of strike prices with several hedge counterparties. The table below provides a view of the economic impact
of the hedge portfolio on the Company’s 2016 fuel costs given significant moves (up to +/-30%) in market fuel prices from December 31, 2015 (in millions).
30% $(1,351) $95 $(1,256)
20% (900) 71 (829)
10% (450) 34 (416)
(10)% 450 (13) 437
(20)% 900 (25) 875
(30)% 1,351 (37) 1,314
(a) Projected using equal shifts in spot and forward prices for aircraft fuel and crude oil underlying hedge contracts from December 31, 2015 levels.
(b) Projection based on a price of $1.14 per gallon, excluding taxes and other delivery costs and estimated consumption of 3.95 billion gallons for the year ending
December 31, 2016.
(c) Change in projected cash gain/(loss) on existing fuel derivatives as of December 31, 2015. Includes all fuel derivatives whether or not the fuel derivatives are designated for
hedge accounting.
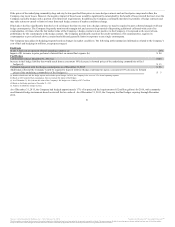
Foreign Currency. The Company generates revenues and incurs expenses in numerous foreign currencies. Changes in foreign currency exchange rates impact
the Company’s results of operations through changes in the dollar value of foreign currency-denominated operating revenues and expenses. Some of the
Company’s more significant foreign currency exposures include the Canadian dollar, Chinese renminbi, European euro, British pound and Japanese yen. At
times, the Company uses derivative financial instruments, such as options, collars and forward contracts, to hedge its exposure to foreign currency. At
December 31, 2015, the Company had foreign currency derivative contracts in place to hedge European euro denominated sales. The notional amount of the
hedges equates to 18% of the Company’s projected European euro denominated net cash inflows for 2016. Net cash relates primarily to passenger ticket sales
inflows partially offset by expenses paid in local currencies. At December 31, 2015, the fair value of the Company’s foreign currency derivatives was not
material to the Company’s financial statements.
The result of a uniform 10 percent strengthening in the value of the U.S. dollar from December 31, 2015 levels relative to each of the currencies in which the
Company has foreign currency exposure would result in a decrease in pre-tax income of approximately $236 million for the year ending December 31, 2016.
This sensitivity analysis was prepared based upon projected 2016 foreign currency-denominated revenues and expenses as of December 31, 2015 and reflects
the potential benefit of the European euro hedges mentioned above.
52
Source: United Continental Holdings, Inc., 10-K, February 18, 2016 Powered by Morningstar® Document Research℠
The information contained herein may not be copied, adapted or distributed and is not warranted to be accurate, complete or timely. The user assumes all risks for any damages or losses arising from any use of this information,
except to the extent such damages or losses cannot be limited or excluded by applicable law. Past financial performance is no guarantee of future results.