United Airlines 2015 Annual Report Download - page 80
Download and view the complete annual report
Please find page 80 of the 2015 United Airlines annual report below. You can navigate through the pages in the report by either clicking on the pages listed below, or by using the keyword search tool below to find specific information within the annual report.-
 1
1 -
2
-
3
-
4
-
5
-
6
-
7
-
8
-
9
-
10
-
11
-
12
-
13
-
14
-
15
-
16
-
17
-
18
-
19
-
20
-
21
-
22
-
23
-
24
-
25
-
26
-
27
-
28
-
29
-
30
-
31
-
32
-
33
-
34
-
35
-
36
-
37
-
38
-
39
-
40
-
41
-
42
-
43
-
44
-
45
-
46
-
47
-
48
-
49
-
50
-
51
-
52
-
53
-
54
-
55
-
56
-
57
-
58
-
59
-
60
-
61
-
62
-
63
-
64
-
65
-
66
-
67
-
68
-
69
-
 70
70 -
 71
71 -
 72
72 -
 73
73 -
 74
74 -
 75
75 -
 76
76 -
 77
77 -
 78
78 -
 79
79 -
 80
80 -
 81
81 -
 82
82 -
 83
83 -
 84
84 -
 85
85 -
 86
86 -
 87
87 -
 88
88 -
 89
89 -
 90
90 -
91
-
92
-
93
-
94
-
95
-
96
-
97
-
98
-
99
-
100
-
101
-
102
-
103
-
104
-
105
-
106
-
107
-
108
-
109
-
110
-
111
-
112
-
113
-
114
-
115
-
116
-
117
-
118
-
119
-
120
-
121
-
122
-
123
-
124
-
125
-
126
-
127
-
128
-
129
-
130
-
131
-
132
-
133
-
134
-
135
-
136
-
137
-
138
-
139
-
140
-
141
-
142
-
143
-
144
-
145
-
146
-
147
-
148
-
149
-
150
-
151
-
152
-
153
-
154
-
155
-
156
-
157
-
158
-
159
-
160
-
161
-
162
-
163
-
164
-
165
-
166
-
167
-
168
-
169
-
170
-
171
-
172
-
173
-
174
 |
 |

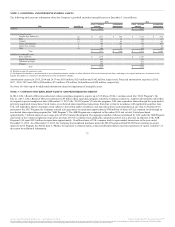
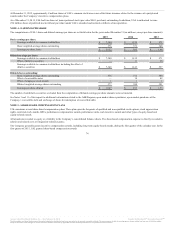
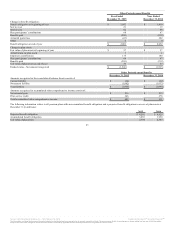
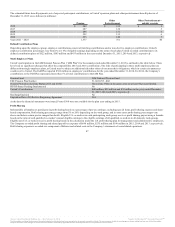
The income tax provision differed from amounts computed at the statutory federal income tax rate, as follows (in millions):
Income tax provision at statutory rate $ 1,477 $ 395 $ 189
State income taxes, net of federal income tax 60 16 5
Foreign income taxes 4 2 3
Nondeductible employee meals 15 15 15
State rate change — — (33)
Valuation allowance (4,684) (441) (219)
Other, net 7 9 8
$(3,121) $ (4) $ (32)
Income tax provision at statutory rate $ 1,477 $ 388 $ 223
State income taxes, net of federal income tax 60 15 5
Foreign income taxes 4 2 3
Nondeductible employee meals 15 15 15
Derivative market adjustment — (7) (24)
State rate change — — (33)
Valuation allowance (4,643) (426) (229)
Other, net 7 9 23
$(3,080) $ (4) $ (17)
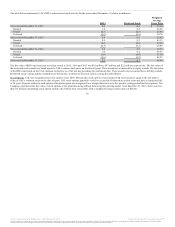
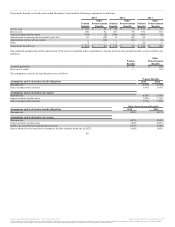
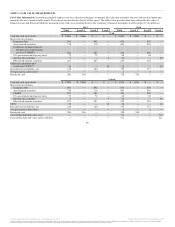
Temporary differences and carryforwards that give rise to deferred tax assets and liabilities at December 31, 2015 and 2014 were as follows (in millions):
Deferred income tax asset (liability):
Federal and state net operating loss (“NOL”) carryforwards $ 2,897 $ 3,491 $ 2,855 $ 3,423
Deferred revenue 2,160 2,287 2,160 2,287
Employee benefits, including pension, postretirement and medical 1,662 1,943 1,662 1,943
Alternative minimum tax (“AMT”) credit carryforwards 232 214 232 214
Other 566 657 566 659
Less: Valuation allowance (48) (4,751) (48) (4,721)
Total deferred tax assets $ 7,469 $ 3,841 $ 7,427 $ 3,805
Depreciation, capitalized interest and other $ (3,921) $(3,212) $(3,921) $(3,212)
Intangibles (1,511) (1,545) (1,511) (1,545)
Other — (84) — (48)
Total deferred tax liabilities $ (5,432) $(4,841) $(5,432) $(4,805)
Net deferred tax asset (liability) $ 2,037 $(1,000) $ 1,995 $(1,000)
79
Source: United Continental Holdings, Inc., 10-K, February 18, 2016 Powered by Morningstar® Document Research℠
The information contained herein may not be copied, adapted or distributed and is not warranted to be accurate, complete or timely. The user assumes all risks for any damages or losses arising from any use of this information,
except to the extent such damages or losses cannot be limited or excluded by applicable law. Past financial performance is no guarantee of future results.