United Airlines 2015 Annual Report Download - page 73
Download and view the complete annual report
Please find page 73 of the 2015 United Airlines annual report below. You can navigate through the pages in the report by either clicking on the pages listed below, or by using the keyword search tool below to find specific information within the annual report.-
 1
1 -
2
-
3
-
4
-
5
-
6
-
7
-
8
-
9
-
10
-
11
-
12
-
13
-
14
-
15
-
16
-
17
-
18
-
19
-
20
-
21
-
22
-
23
-
24
-
25
-
26
-
27
-
28
-
29
-
30
-
31
-
32
-
33
-
34
-
35
-
36
-
37
-
38
-
39
-
40
-
41
-
42
-
43
-
44
-
45
-
46
-
47
-
48
-
49
-
50
-
51
-
52
-
53
-
54
-
55
-
56
-
57
-
58
-
59
-
60
-
61
-
62
-
 63
63 -
 64
64 -
 65
65 -
 66
66 -
 67
67 -
 68
68 -
 69
69 -
 70
70 -
 71
71 -
 72
72 -
 73
73 -
 74
74 -
 75
75 -
 76
76 -
 77
77 -
 78
78 -
 79
79 -
 80
80 -
 81
81 -
 82
82 -
 83
83 -
84
-
85
-
86
-
87
-
88
-
89
-
90
-
91
-
92
-
93
-
94
-
95
-
96
-
97
-
98
-
99
-
100
-
101
-
102
-
103
-
104
-
105
-
106
-
107
-
108
-
109
-
110
-
111
-
112
-
113
-
114
-
115
-
116
-
117
-
118
-
119
-
120
-
121
-
122
-
123
-
124
-
125
-
126
-
127
-
128
-
129
-
130
-
131
-
132
-
133
-
134
-
135
-
136
-
137
-
138
-
139
-
140
-
141
-
142
-
143
-
144
-
145
-
146
-
147
-
148
-
149
-
150
-
151
-
152
-
153
-
154
-
155
-
156
-
157
-
158
-
159
-
160
-
161
-
162
-
163
-
164
-
165
-
166
-
167
-
168
-
169
-
170
-
171
-
172
-
173
-
174
 |
 |

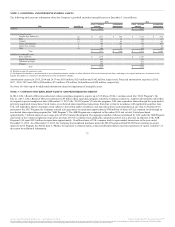
(s) The Company has third-party business revenue that includes fuel sales, catering, ground handling, maintenance services
and frequent flyer award non-air redemptions, and third-party business revenue is recorded in Other operating revenue. The Company also incurs
third-party business expenses, such as maintenance, ground handling and catering services for third parties, fuel sales and non-air mileage
redemptions, and those third-party business expenses are recorded in Other operating expenses.
(t) The Financial Accounting Standards Board (“FASB”) amended the FASB Accounting Standards
Codification and created a new Topic 606, This amendment prescribes that an entity should recognize
revenue to depict the transfer of promised goods or services to customers in an amount that reflects the consideration to which the entity expects to
be entitled in exchange for those goods or services. The amendment supersedes the revenue recognition requirements in Topic 605,
, and most industry-specific guidance throughout the Industry Topics of the Codification, and is effective for annual and interim
reporting periods beginning after December 15, 2017. Under the new standard, certain airline ancillary fees directly related to passenger revenue
tickets, such as airline change fees and baggage fees, are likely to no longer be considered distinct performance obligations separate from the
passenger travel component. In addition, the change fees which were previously recognized when received, will likely be recognized when
transportation is provided. The Company is evaluating other impacts on its consolidated financial statements.
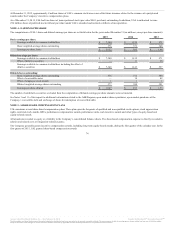
The FASB issued Accounting Standards Update No. 2015-03,
This standard amends existing guidance to require the presentation of debt issuance costs in the balance sheet as a deduction
from the carrying amount of the related debt liability instead of a deferred charge. The Company adopted the standard as of December 31, 2015. As
a result of the adoption, unamortized debt issuance costs previously recorded as an asset on the Company’s balance sheet included under the
caption Other, net are now reclassified and presented as a deduction from the carrying amount of the related debt liability. The reclassified
amounts were $170 million and $167 million as of December 31, 2015 and 2014, respectively.
The FASB issued Accounting Standards Update No. 2015-07,
Under the standard, investments for which fair value is measured at net asset
value per share (or its equivalent) using the practical expedient will no longer be categorized in the fair value hierarchy. It is effective for fiscal
years and interim periods beginning after December 15, 2015, but early adoption is permitted. As of December 31, 2015, the Company had
approximately $200 million of such investments as part of Short-term investments balance sheet total. In addition, pension plan investments
measured at net asset value per share will no longer be categorized within the fair value hierarchy. As of December 31, 2015, the Company had
approximately $1.4 billion of such investments. The Company is evaluating other impacts on its consolidated financial statements.
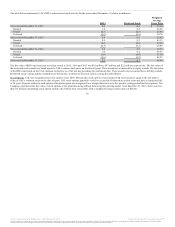
The FASB issued Accounting Standards Update No. 2015-17, . This standard amends existing
guidance to require companies to classify all deferred tax assets and liabilities as noncurrent in the statement of financial position. For a particular
tax-paying component of an entity and within a particular tax jurisdiction, all deferred tax liabilities and assets, as well as any related valuation
allowance, shall be offset and presented as a single noncurrent amount. As a result, companies will no longer allocate valuation allowances
between current and noncurrent deferred tax assets because those allowances also will be classified as noncurrent. As of December 31, 2015, the
Company adopted this standard and reclassified approximately $1.5 billion from Current assets: Deferred income taxes to Other assets: Deferred
income taxes as of December 31, 2015, and reclassified $591 million from Current assets: Deferred income taxes to Other liabilities and deferred
credits: Deferred income taxes as of December 31, 2014.
72
Source: United Continental Holdings, Inc., 10-K, February 18, 2016 Powered by Morningstar® Document Research℠
The information contained herein may not be copied, adapted or distributed and is not warranted to be accurate, complete or timely. The user assumes all risks for any damages or losses arising from any use of this information,
except to the extent such damages or losses cannot be limited or excluded by applicable law. Past financial performance is no guarantee of future results.