United Airlines 2015 Annual Report Download - page 39
Download and view the complete annual report
Please find page 39 of the 2015 United Airlines annual report below. You can navigate through the pages in the report by either clicking on the pages listed below, or by using the keyword search tool below to find specific information within the annual report.-
 1
1 -
2
-
3
-
4
-
5
-
6
-
7
-
8
-
9
-
10
-
11
-
12
-
13
-
14
-
15
-
16
-
17
-
18
-
19
-
20
-
21
-
22
-
23
-
24
-
25
-
26
-
27
-
28
-
 29
29 -
 30
30 -
 31
31 -
 32
32 -
 33
33 -
 34
34 -
 35
35 -
 36
36 -
 37
37 -
 38
38 -
 39
39 -
 40
40 -
 41
41 -
 42
42 -
 43
43 -
 44
44 -
 45
45 -
 46
46 -
 47
47 -
 48
48 -
 49
49 -
50
-
51
-
52
-
53
-
54
-
55
-
56
-
57
-
58
-
59
-
60
-
61
-
62
-
63
-
64
-
65
-
66
-
67
-
68
-
69
-
70
-
71
-
72
-
73
-
74
-
75
-
76
-
77
-
78
-
79
-
80
-
81
-
82
-
83
-
84
-
85
-
86
-
87
-
88
-
89
-
90
-
91
-
92
-
93
-
94
-
95
-
96
-
97
-
98
-
99
-
100
-
101
-
102
-
103
-
104
-
105
-
106
-
107
-
108
-
109
-
110
-
111
-
112
-
113
-
114
-
115
-
116
-
117
-
118
-
119
-
120
-
121
-
122
-
123
-
124
-
125
-
126
-
127
-
128
-
129
-
130
-
131
-
132
-
133
-
134
-
135
-
136
-
137
-
138
-
139
-
140
-
141
-
142
-
143
-
144
-
145
-
146
-
147
-
148
-
149
-
150
-
151
-
152
-
153
-
154
-
155
-
156
-
157
-
158
-
159
-
160
-
161
-
162
-
163
-
164
-
165
-
166
-
167
-
168
-
169
-
170
-
171
-
172
-
173
-
174
 |
 |

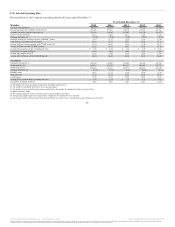
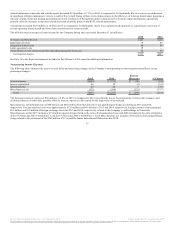
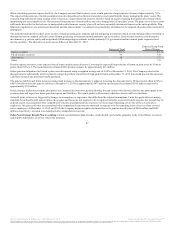
The table below presents special items incurred by UAL during the years ended December 31 (in millions):
Severance and benefit costs $199 $105
Impairment of assets 49 33
Integration-related costs 96 205
Labor agreement costs — 127
(Gains) losses on sale of assets and other miscellaneous (gains) losses, net 99 50
Total special charges $443 $520
See Note 16 to the financial statements included in Part II, Item 8 of this report for additional information.
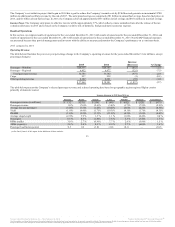
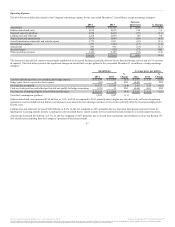
Nonoperating Income (Expense)
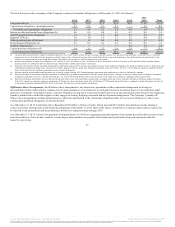
The following table illustrates the year-over-year dollar and percentage changes in UAL’s nonoperating income (expense) (in millions, except percentage
changes):
Interest expense $ (735) $(783) $ (48) (6.1)
Interest capitalized 52 49 3 6.1
Interest income 22 21 1 4.8
Miscellaneous, net (584) 3 (587) NM
Total $(1,245) $(710) $ 535 75.4
The decrease in interest expense of $48 million, or 6.1%, in 2014 as compared to 2013 was primarily due to the Company’s extinguishment of certain of its
debt instruments and the refinancing of certain of its debt instruments at lower interest rates.
In 2014, Miscellaneous, net included a MTM loss of $462 million from fuel derivatives not qualifying for hedge accounting as compared to a gain of $79
million in 2013. Miscellaneous, net also included foreign currency losses of $41 million and $29 million in 2014 and 2013, respectively. 2014
Miscellaneous, net includes a $64 million debt extinguishment charge related to the retirement of the $248 million 6% Convertible Junior Subordinated
Debentures due 2030.
United’s nonoperating expense also included a net gain of $19 million associated with marking to market the fair value of derivative assets and liabilities
related to agreements that provide for United’s convertible debt to be settled with UAL common stock as compared to a net gain of $70 million in 2013.
These net gains and related derivatives are reflected only in the United stand-alone financial statements as they are eliminated at the consolidated level. See
Note 9 to the financial statements included in Part II, Item 8 of this report for additional information.
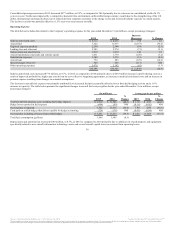
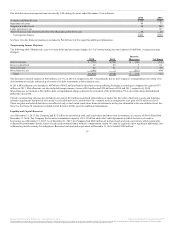
Liquidity and Capital Resources
As of December 31, 2015, the Company had $5.2 billion in unrestricted cash, cash equivalents and short-term investments, an increase of $0.8 billion from
December 31, 2014. The Company had its entire commitment capacity of $1.35 billion under the Credit Agreement available for letters of credit or
borrowings as of December 31, 2015. As of December 31, 2015, the Company had $206 million of restricted cash and cash equivalents, which is primarily
collateral for performance bonds, letters of credit and estimated future workers’ compensation claims. We may be required to post significant additional cash
collateral to provide security for obligations. Restricted cash and cash equivalents at December 31, 2014 totaled $320 million.
38
Source: United Continental Holdings, Inc., 10-K, February 18, 2016 Powered by Morningstar® Document Research℠
The information contained herein may not be copied, adapted or distributed and is not warranted to be accurate, complete or timely. The user assumes all risks for any damages or losses arising from any use of this information,
except to the extent such damages or losses cannot be limited or excluded by applicable law. Past financial performance is no guarantee of future results.