United Airlines 2015 Annual Report Download - page 34
Download and view the complete annual report
Please find page 34 of the 2015 United Airlines annual report below. You can navigate through the pages in the report by either clicking on the pages listed below, or by using the keyword search tool below to find specific information within the annual report.-
 1
1 -
2
-
3
-
4
-
5
-
6
-
7
-
8
-
9
-
10
-
11
-
12
-
13
-
14
-
15
-
16
-
17
-
18
-
19
-
20
-
21
-
22
-
23
-
 24
24 -
 25
25 -
 26
26 -
 27
27 -
 28
28 -
 29
29 -
 30
30 -
 31
31 -
 32
32 -
 33
33 -
 34
34 -
 35
35 -
 36
36 -
 37
37 -
 38
38 -
 39
39 -
 40
40 -
 41
41 -
 42
42 -
 43
43 -
 44
44 -
45
-
46
-
47
-
48
-
49
-
50
-
51
-
52
-
53
-
54
-
55
-
56
-
57
-
58
-
59
-
60
-
61
-
62
-
63
-
64
-
65
-
66
-
67
-
68
-
69
-
70
-
71
-
72
-
73
-
74
-
75
-
76
-
77
-
78
-
79
-
80
-
81
-
82
-
83
-
84
-
85
-
86
-
87
-
88
-
89
-
90
-
91
-
92
-
93
-
94
-
95
-
96
-
97
-
98
-
99
-
100
-
101
-
102
-
103
-
104
-
105
-
106
-
107
-
108
-
109
-
110
-
111
-
112
-
113
-
114
-
115
-
116
-
117
-
118
-
119
-
120
-
121
-
122
-
123
-
124
-
125
-
126
-
127
-
128
-
129
-
130
-
131
-
132
-
133
-
134
-
135
-
136
-
137
-
138
-
139
-
140
-
141
-
142
-
143
-
144
-
145
-
146
-
147
-
148
-
149
-
150
-
151
-
152
-
153
-
154
-
155
-
156
-
157
-
158
-
159
-
160
-
161
-
162
-
163
-
164
-
165
-
166
-
167
-
168
-
169
-
170
-
171
-
172
-
173
-
174
 |
 |

The Company’s cost initiative project that began in 2014 has a goal to reduce the Company’s annual costs by $2 billion and generate an incremental $700
million in additional ancillary revenue by the end of 2017. The anticipated savings are comprised of $1 billion in annual fuel savings, based on fuel prices in
2013, and $1 billion of non-fuel savings. In 2015, the Company achieved approximately $555 million in fuel savings and $851 million in non-fuel savings.
Income Taxes. The Company anticipates its effective tax rate will be approximately 37%, which reflects a more normalized rate after the release of the tax
valuation allowance in 2015 and is based on the Company’s relative mix of domestic, foreign and state income tax expense.
In this section, we compare results of operations for the year ended December 31, 2015 with results of operations for the year ended December 31, 2014, and
results of operations for the year ended December 31, 2014 with results of operations for the year ended December 31, 2013. Non-GAAP financial measures
are presented because they provide management and investors with the ability to measure and monitor the Company’s performance on a consistent basis.
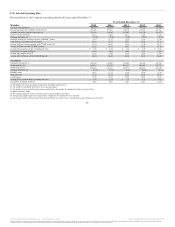
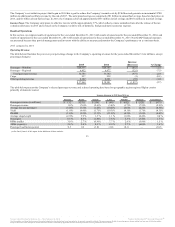
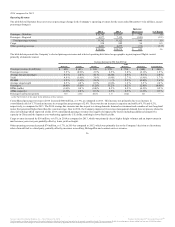
Operating Revenue
The table below illustrates the year-over-year percentage change in the Company’s operating revenues for the years ended December 31 (in millions, except
percentage changes):
Passenger—Mainline $26,333 $26,785 $ (452) (1.7)
Passenger—Regional 6,452 6,977 (525) (7.5)
Total passenger revenue 32,785 33,762 (977) (2.9)
Cargo 937 938 (1) (0.1)
Other operating revenue 4,142 4,201 (59) (1.4)
$ 37,864 $ 38,901 $ (1,037) (2.7)
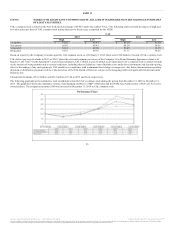
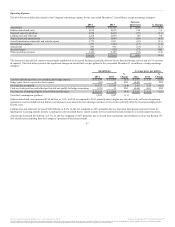
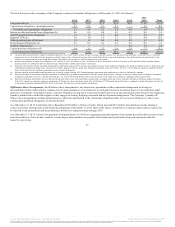
The table below presents the Company’s selected passenger revenue and selected operating data based on geographic region (regional flights consist
primarily of domestic routes):
Passenger revenue (in millions) $ 132 $(331) $ (159) $ (94) $ (452) $ (525) $ (977)
Passenger revenue 1.0 % (7.0)% (2.6)% (3.4)% (1.7)% (7.5)% (2.9)%
Average fare per passenger (5.0)% (7.5)% (1.2)% (10.2)% (6.6)% (2.2)% (4.5)%
Yield (1.9)% (9.4)% (1.7)% (10.3)% (4.1)% (1.7)% (4.3)%
PRASM (1.6)% (9.2)% (3.1)% (11.3)% (4.3)% (1.6)% (4.4)%
Average stage length (2.9)% 3.9 % 1.3 % 1.1 % (1.8)% (0.4)% 0.4 %
Passengers 6.3 % 0.5 % (1.4)% 7.6 % 5.3 % (5.4)% 1.7 %
RPMs (traffic) 3.0 % 2.7 % (0.9)% 7.7 % 2.6 % (5.9)% 1.5 %
ASMs (capacity) 2.6 % 2.4 % 0.5 % 8.9 % 2.7 % (6.0)% 1.6 %
Passenger load factor (points) 0.3 0.2 (1.0) (1.0) (0.1) — (0.2)
(a) See Part II, Item 6 of this report for the definition of these statistics.
33
Source: United Continental Holdings, Inc., 10-K, February 18, 2016 Powered by Morningstar® Document Research℠
The information contained herein may not be copied, adapted or distributed and is not warranted to be accurate, complete or timely. The user assumes all risks for any damages or losses arising from any use of this information,
except to the extent such damages or losses cannot be limited or excluded by applicable law. Past financial performance is no guarantee of future results.