United Airlines 2015 Annual Report Download - page 88
Download and view the complete annual report
Please find page 88 of the 2015 United Airlines annual report below. You can navigate through the pages in the report by either clicking on the pages listed below, or by using the keyword search tool below to find specific information within the annual report.-
 1
1 -
2
-
3
-
4
-
5
-
6
-
7
-
8
-
9
-
10
-
11
-
12
-
13
-
14
-
15
-
16
-
17
-
18
-
19
-
20
-
21
-
22
-
23
-
24
-
25
-
26
-
27
-
28
-
29
-
30
-
31
-
32
-
33
-
34
-
35
-
36
-
37
-
38
-
39
-
40
-
41
-
42
-
43
-
44
-
45
-
46
-
47
-
48
-
49
-
50
-
51
-
52
-
53
-
54
-
55
-
56
-
57
-
58
-
59
-
60
-
61
-
62
-
63
-
64
-
65
-
66
-
67
-
68
-
69
-
70
-
71
-
72
-
73
-
74
-
75
-
76
-
77
-
 78
78 -
 79
79 -
 80
80 -
 81
81 -
 82
82 -
 83
83 -
 84
84 -
 85
85 -
 86
86 -
 87
87 -
 88
88 -
 89
89 -
 90
90 -
 91
91 -
 92
92 -
 93
93 -
 94
94 -
 95
95 -
 96
96 -
 97
97 -
 98
98 -
99
-
100
-
101
-
102
-
103
-
104
-
105
-
106
-
107
-
108
-
109
-
110
-
111
-
112
-
113
-
114
-
115
-
116
-
117
-
118
-
119
-
120
-
121
-
122
-
123
-
124
-
125
-
126
-
127
-
128
-
129
-
130
-
131
-
132
-
133
-
134
-
135
-
136
-
137
-
138
-
139
-
140
-
141
-
142
-
143
-
144
-
145
-
146
-
147
-
148
-
149
-
150
-
151
-
152
-
153
-
154
-
155
-
156
-
157
-
158
-
159
-
160
-
161
-
162
-
163
-
164
-
165
-
166
-
167
-
168
-
169
-
170
-
171
-
172
-
173
-
174
 |
 |

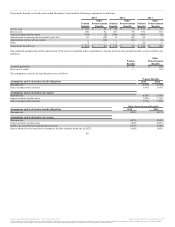
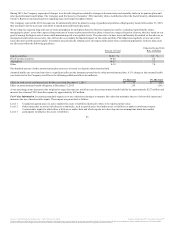
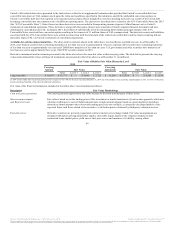
The estimated future benefit payments, net of expected participant contributions, in United’s pension plans and other postretirement benefit plans as of
December 31, 2015 are as follows (in millions):
2016 $ 282 $ 125 $ 5
2017 287 128 5
2018 286 131 6
2019 292 135 6
2020 293 140 7
Years 2021 – 2025 1,577 761 40
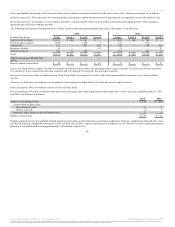
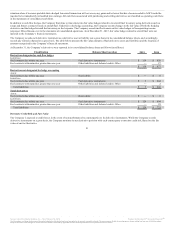
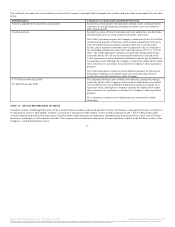
Depending upon the employee group, employer contributions consist of matching contributions and/or non-elective employer contributions. United’s
employer contribution percentages vary from 1% to 16% of eligible earnings depending on the terms of each plan. United recorded contributions to its
defined contribution plans of $522 million, $503 million and $433 million in the years ended December 31, 2015, 2014 and 2013, respectively.
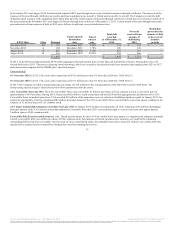
United’s participation in the IAM National Pension Plan (“IAM Plan”) for the annual period ended December 31, 2015 is outlined in the table below. There
have been no significant changes that affect the comparability 2015 and 2014 contributions. The risks of participating in these multi-employer plans are
different from single-employer plans, as United may be subject to additional risks that others do not meet their obligations, which in certain circumstances
could revert to United. The IAM Plan reported $382 million in employers’ contributions for the year ended December 31, 2014. For 2014, the Company’s
contributions to the IAM Plan represented more than 5% of total contributions to the IAM Plan.
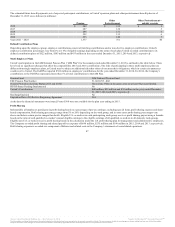
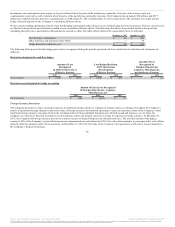
Pension Fund IAM National Pension Fund
EIN/ Pension Plan Number 51-6031295 - 002
Pension Protection Act Zone Status (2015 and 2014) Green Zone. Plans in the green zone are at least 80 percent funded.
FIP/RP Status Pending/Implemented No
United’s Contributions
$40 million, $39 million and $38 million in the years ended December
31, 2015, 2014 and 2013, respectively
Surcharge Imposed No
Expiration Date of Collective Bargaining Agreement N/A
At the date the financial statements were issued, Forms 5500 were not available for the plan year ending in 2015.
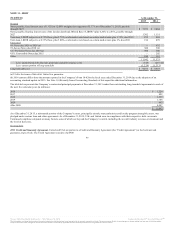
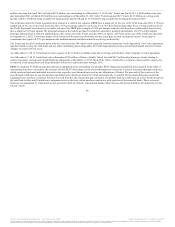
Substantially all employees participate in profit sharing based on a percentage of pre-tax earnings, excluding special items, profit sharing expense and share-
based compensation. Profit sharing percentages range from 5% to 20% depending on the work group, and in some cases profit sharing percentages vary
above and below certain pre-tax margin thresholds. Eligible U.S. co-workers in each participating work group receive a profit sharing payout using a formula
based on the ratio of each qualified co-worker’s annual eligible earnings to the eligible earnings of all qualified co-workers in all domestic work groups.
Eligible non-U.S. co-workers receive profit sharing based on the calculation under the U.S. profit sharing plan for management and administrative employees.
The Company recorded profit sharing and related payroll tax expense of $698 million, $235 million and $190 million in 2015, 2014 and 2013, respectively.
Profit sharing expense is recorded as a component of Salaries and related costs in the Company’s statements of consolidated operations.
87
Source: United Continental Holdings, Inc., 10-K, February 18, 2016 Powered by Morningstar® Document Research℠
The information contained herein may not be copied, adapted or distributed and is not warranted to be accurate, complete or timely. The user assumes all risks for any damages or losses arising from any use of this information,
except to the extent such damages or losses cannot be limited or excluded by applicable law. Past financial performance is no guarantee of future results.