United Airlines 2015 Annual Report Download - page 35
Download and view the complete annual report
Please find page 35 of the 2015 United Airlines annual report below. You can navigate through the pages in the report by either clicking on the pages listed below, or by using the keyword search tool below to find specific information within the annual report.-
 1
1 -
2
-
3
-
4
-
5
-
6
-
7
-
8
-
9
-
10
-
11
-
12
-
13
-
14
-
15
-
16
-
17
-
18
-
19
-
20
-
21
-
22
-
23
-
24
-
 25
25 -
 26
26 -
 27
27 -
 28
28 -
 29
29 -
 30
30 -
 31
31 -
 32
32 -
 33
33 -
 34
34 -
 35
35 -
 36
36 -
 37
37 -
 38
38 -
 39
39 -
 40
40 -
 41
41 -
 42
42 -
 43
43 -
 44
44 -
 45
45 -
46
-
47
-
48
-
49
-
50
-
51
-
52
-
53
-
54
-
55
-
56
-
57
-
58
-
59
-
60
-
61
-
62
-
63
-
64
-
65
-
66
-
67
-
68
-
69
-
70
-
71
-
72
-
73
-
74
-
75
-
76
-
77
-
78
-
79
-
80
-
81
-
82
-
83
-
84
-
85
-
86
-
87
-
88
-
89
-
90
-
91
-
92
-
93
-
94
-
95
-
96
-
97
-
98
-
99
-
100
-
101
-
102
-
103
-
104
-
105
-
106
-
107
-
108
-
109
-
110
-
111
-
112
-
113
-
114
-
115
-
116
-
117
-
118
-
119
-
120
-
121
-
122
-
123
-
124
-
125
-
126
-
127
-
128
-
129
-
130
-
131
-
132
-
133
-
134
-
135
-
136
-
137
-
138
-
139
-
140
-
141
-
142
-
143
-
144
-
145
-
146
-
147
-
148
-
149
-
150
-
151
-
152
-
153
-
154
-
155
-
156
-
157
-
158
-
159
-
160
-
161
-
162
-
163
-
164
-
165
-
166
-
167
-
168
-
169
-
170
-
171
-
172
-
173
-
174
 |
 |

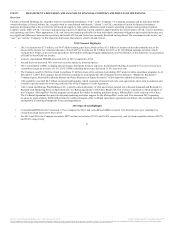
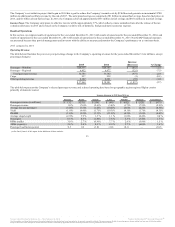
Consolidated passenger revenue in 2015 decreased $977 million, or 2.9%, as compared to 2014 primarily due to a decrease in consolidated yield of 4.3%
year-over-year. Yields were impacted by a competitive domestic fare environment, unfavorable foreign currency results due to the strengthening of the U.S.
dollar, international surcharge declines, travel reductions from corporate customers in the energy sector and increased industry capacity in certain regions.
The decline in yields was partially offset by a 1.5% year-over-year increase in traffic.
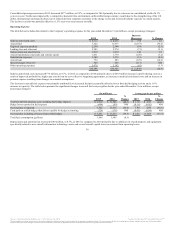
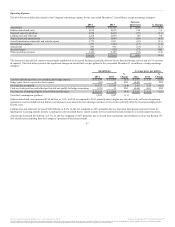
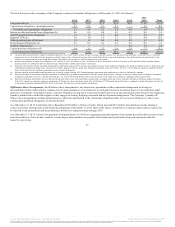
Operating Expense
The table below includes data related to the Company’s operating expense for the year ended December 31 (in millions, except percentage changes):
Salaries and related costs $ 9,713 $ 8,935 $ 778 8.7
Aircraft fuel 7,522 11,675 (4,153) (35.6)
Regional capacity purchase 2,290 2,344 (54) (2.3)
Landing fees and other rent 2,203 2,274 (71) (3.1)
Depreciation and amortization 1,819 1,679 140 8.3
Aircraft maintenance materials and outside repairs 1,651 1,779 (128) (7.2)
Distribution expenses 1,342 1,373 (31) (2.3)
Aircraft rent 754 883 (129) (14.6)
Special charges (Note 16) 326 443 (117) NM
Other operating expenses 5,078 5,143 (65) (1.3)
$32,698 $36,528 $ (3,830) (10.5)
Salaries and related costs increased $778 million, or 8.7%, in 2015 as compared to 2014 primarily due to a $463 million increase in profit sharing costs as a
result of improved profitability, higher pay rates driven by new collective bargaining agreements, an increase in medical and dental costs and an increase in
pension expense resulting from changes in actuarial assumptions.
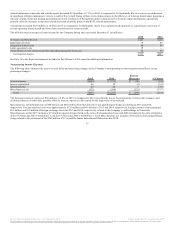
The decrease in aircraft fuel expense was primarily attributable to decreased fuel prices partially offset by losses from fuel hedging activity and a 1.6%
increase in capacity. The table below presents the significant changes in aircraft fuel cost per gallon for the year ended December 31 (in millions, except
percentage changes):
Total aircraft fuel purchase cost excluding fuel hedge impacts $ 6,918 $ 11,586 (40.3) $ 1.78 $ 2.97 (40.1)
Hedge losses reported in fuel expense (604) (89) NM (0.16) (0.02) NM
Fuel expense as reported 7,522 11,675 (35.6) 1.94 2.99 (35.1)
Cash paid on settled hedges that did not qualify for hedge accounting (329) (138) NM (0.08) (0.04) NM
Fuel expense including all losses from settled hedges $ 7,851 $ 11,813 (33.5) $ 2.02 $ 3.03 (33.3)
Total fuel consumption (gallons) 3,886 3,905 (0.5)
Depreciation and amortization increased $140 million, or 8.3%, in 2015 as compared to 2014 primarily due to additions in owned property and equipment,
specifically related to new aircraft, information technology assets and several aircraft capital lease conversions from operating leases.
34
Source: United Continental Holdings, Inc., 10-K, February 18, 2016 Powered by Morningstar® Document Research℠
The information contained herein may not be copied, adapted or distributed and is not warranted to be accurate, complete or timely. The user assumes all risks for any damages or losses arising from any use of this information,
except to the extent such damages or losses cannot be limited or excluded by applicable law. Past financial performance is no guarantee of future results.