United Airlines 2015 Annual Report Download - page 81
Download and view the complete annual report
Please find page 81 of the 2015 United Airlines annual report below. You can navigate through the pages in the report by either clicking on the pages listed below, or by using the keyword search tool below to find specific information within the annual report.-
 1
1 -
2
-
3
-
4
-
5
-
6
-
7
-
8
-
9
-
10
-
11
-
12
-
13
-
14
-
15
-
16
-
17
-
18
-
19
-
20
-
21
-
22
-
23
-
24
-
25
-
26
-
27
-
28
-
29
-
30
-
31
-
32
-
33
-
34
-
35
-
36
-
37
-
38
-
39
-
40
-
41
-
42
-
43
-
44
-
45
-
46
-
47
-
48
-
49
-
50
-
51
-
52
-
53
-
54
-
55
-
56
-
57
-
58
-
59
-
60
-
61
-
62
-
63
-
64
-
65
-
66
-
67
-
68
-
69
-
70
-
 71
71 -
 72
72 -
 73
73 -
 74
74 -
 75
75 -
 76
76 -
 77
77 -
 78
78 -
 79
79 -
 80
80 -
 81
81 -
 82
82 -
 83
83 -
 84
84 -
 85
85 -
 86
86 -
 87
87 -
 88
88 -
 89
89 -
 90
90 -
 91
91 -
92
-
93
-
94
-
95
-
96
-
97
-
98
-
99
-
100
-
101
-
102
-
103
-
104
-
105
-
106
-
107
-
108
-
109
-
110
-
111
-
112
-
113
-
114
-
115
-
116
-
117
-
118
-
119
-
120
-
121
-
122
-
123
-
124
-
125
-
126
-
127
-
128
-
129
-
130
-
131
-
132
-
133
-
134
-
135
-
136
-
137
-
138
-
139
-
140
-
141
-
142
-
143
-
144
-
145
-
146
-
147
-
148
-
149
-
150
-
151
-
152
-
153
-
154
-
155
-
156
-
157
-
158
-
159
-
160
-
161
-
162
-
163
-
164
-
165
-
166
-
167
-
168
-
169
-
170
-
171
-
172
-
173
-
174
 |
 |

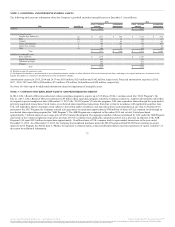
United and its domestic consolidated subsidiaries file a consolidated federal income tax return with UAL. Under an intercompany tax allocation policy,
United and its subsidiaries compute, record and pay UAL for their own tax liability as if they were separate companies filing separate returns. In determining
their own tax liabilities, United and each of its subsidiaries take into account all tax credits or benefits generated and utilized as separate companies and they
are each compensated for the aforementioned tax benefits only if they would be able to use those benefits on a separate company basis.
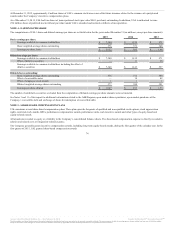
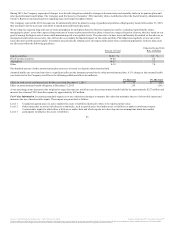
The federal and state NOL carryforwards relate to prior years’ NOLs, which may be used to reduce tax liabilities in future years. These tax benefits are mostly
attributable to federal pre-tax NOL carryforwards of $8.0 billion for UAL. If not utilized these federal pre-tax NOLs will expire as follows (in billions): $2.1 in
2025, $2.0 in 2026, $1.4 in 2027 and $2.5 after 2028. In addition, the majority of tax benefits of the state net operating losses of $103 million for UAL will
expire over a five to 20-year period. Additionally, the Company has $232 million of AMT credit carryforwards which do not expire.
The Company’s income tax benefit was $3.1 billion for the year ended December 31, 2015. A discrete tax benefit of $3.1 billion for the reduction to the U.S.
net federal and state deferred tax asset valuation allowance was included in the income tax benefit for the year ended December 31, 2015.
During 2015, after considering all positive and negative evidence and the four sources of taxable income, the Company concluded that its deferred income
tax assets are more likely than not to be realized. In evaluating the likelihood of utilizing the Company’s net federal and state deferred tax assets, the
significant relevant factors that the Company considered are: (1) its recent history and forecasted profitability; (2) growth in the U.S. and global economies;
and (3) future impact of taxable temporary differences. Although the Company was not in a three-year cumulative loss position at December 31, 2014,
management concluded that the low level of cumulative pre-tax income, coupled with the Company’s history of operating losses resulted in a determination
that a valuation allowance was still necessary. We considered past profitability and future expectations of profitability to determine whether it is more likely
than not that we will generate sufficient taxable income to realize our net deferred tax assets. Management placed significant weight on past performance (i.e.,
losses or near break-even results in 2009 to 2013) as it is more objectively verifiable than projections of future taxable income. However, during 2015, the
Company’s pre-tax profit of $4.2 billion benefited from lower oil prices and improved efficiency that resulted in significant taxable income. Additionally,
based upon current projection of future earnings, the Company evaluated the NOLs expiration periods and change in ownership limitations under
Section 382 of the Internal Revenue Code of 1986, as amended, and determined the NOLs would be realized before expiring beginning in 2025. Therefore,
the Company released almost all of its valuation allowance in 2015, resulting in a $3.1 billion benefit in its provision for income taxes. The valuation
allowance recorded in AOCI in prior years was released through the income statement and resulted in remaining debits within AOCI of $285 million and
$180 million related to pension and derivatives, respectively, which will not be recognized into income tax expense until either the plans are exited or the
Company no longer has any outstanding derivatives.
The Company has retained a valuation allowance of $48 million against certain state and local NOLs and credit carryforwards at the end of 2015. The
Company expects these NOLs and credits will expire unused due to limited carryforward periods. The ability to utilize these state NOLs and credits will be
evaluated on a quarterly basis to determine if there are any significant events or any prudent and feasible tax planning strategies that would affect the
Company’s ability to realize these deferred tax assets.
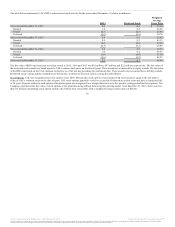
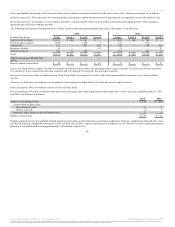
The Company’s effective tax rates differ from the federal statutory rate of 35% primarily because of the impact of changes to existing valuation allowances.
The change in the effective tax rate each period is impacted by a number of factors, including the relative mix of domestic and state income tax expense in
the U.S., adjustments to the valuation allowances and discrete items. During 2015, the Company reversed a significant portion of valuation allowances. Of
the $4.7 billion reversed, $1.5 billion relates to current year income.
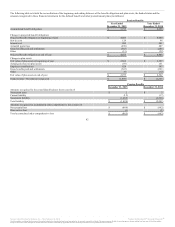
The Company’s unrecognized tax benefits related to uncertain tax positions were $24 million, $9 million and $14 million at 2015, 2014 and 2013,
respectively. Included in the ending balance at 2015 is $21 million that would affect the Company’s effective tax rate if recognized. The changes in
unrecognized tax benefits relating to
80
Source: United Continental Holdings, Inc., 10-K, February 18, 2016 Powered by Morningstar® Document Research℠
The information contained herein may not be copied, adapted or distributed and is not warranted to be accurate, complete or timely. The user assumes all risks for any damages or losses arising from any use of this information,
except to the extent such damages or losses cannot be limited or excluded by applicable law. Past financial performance is no guarantee of future results.